


 India–U.S. Interim Trade Pact Cuts Auto Tariffs but Leaves Tesla Out
  Gold and Silver Prices Climb in Asian Trade as Markets Eye Key U.S. Economic Data
  Russian Stocks End Mixed as MOEX Index Closes Flat Amid Commodity Strength
  Asian Stocks Slip as Tech Rout Deepens, Japan Steadies Ahead of Election
  U.S. Stock Futures Slide as Tech Rout Deepens on Amazon Capex Shock
  FxWirePro- Major Crypto levels and bias summary
  JPMorgan Lifts Gold Price Forecast to $6,300 by End-2026 on Strong Central Bank and Investor Demand
  Oil Prices Slip as U.S.-Iran Talks Ease Middle East Tensions
  China Extends Gold Buying Streak as Reserves Surge Despite Volatile Prices
  Trump Signs Executive Order Threatening 25% Tariffs on Countries Trading With Iran


In an attempt to challenge the disparities in the way people from different backgrounds are treated in Britain, the government has launched a race disparity audit. A new website called Ethnicity Facts and Figures presents statistics on issues including education, health and employment – for example that white people have a higher employment rate than people from ethnic minorities.
Theresa May’s new website intends to – rightfully – examine where there are problems of the marginalisation of some of Britain’s ethnic minorities. But such analysis is a sensitive and complex issue. Before attributing differences in social outcomes to discrimination, it is important to take account of all the mechanisms involved in the uneven distribution of educational, health or employment outcomes. Where people live in relation to other people matters – as well as their relationship with their city and its public services.
Speaking ahead of the audit’s publication at the Conservative’s party conference in Manchester in early October, May admitted:
The idea itself is not new, Charles Booth’s maps of rich and poor areas in Victorian London drew attention to hardship that was too often hidden, but this focus on how ethnicity affects people’s lives will present findings that are uncomfortable.
My own research, which has used Booth’s data, has shown that it is too simplistic to associate ethnicity, or race – or any sort of social situation – with hardship.
Booth’s study aimed to classify every street, court and block of buildings across the metropolis by direct observation. The street study was captured on a detailed map first published in 1889, which finely delineated gradations of poverty and prosperity using different colours. Black, dark blue and light blue was used for the poorest classes, through pink and red to gold, for the wealthiest. As the section of the map below shows, he was able to illustrate how frequently poor streets were situated cheek by jowl with wealthier streets.
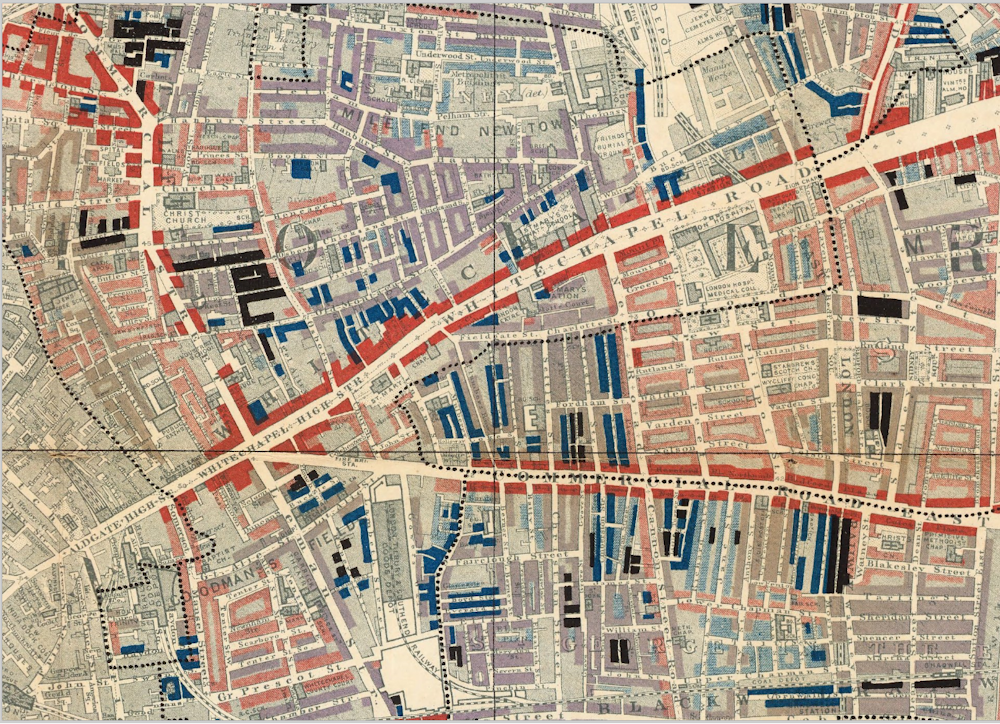
Sample area from Charles Booth’s Descriptive Map of London Poverty 1889 showing marginal separation of poverty (in the darker shades from light blue down to black) from relative prosperity (in pink and red). Image copyright © 2000 by Cartography Associates.
The survey and its maps drew extensive press coverage at the time. The Guardian, for example, stated that Booth’s map of poverty had lifted the “curtain behind which East London had been hidden …” and presented the nation with a “physical chart of sorrow, suffering and crime.”
Location really matters
The physical segregation of poor areas from wealthier parts of a city can exacerbate the disadvantages of the impoverished individuals who live there, especially if it continues over a long period of time. These disadvantages can include the concentration of inadequate housing, bad health and other cycles of economic deprivation in a certain area. In turn, these can affect access to open space for recreation or for walking, make residents more vulnerable to crime, or provide them unequal access to jobs due to poor public transport.
Space syntax architectural research methods can objectively assess how easy it is to access each street from all others, and so how frequently each street is likely to be used as a route between other streets in order to gain access to the city at large. My analysis has shown how streets, and sometimes even entire areas, can be rendered inaccessible due to the way the city is laid out, or due to an area’s severance by a railway line or a busy road. Over time, an area can suffer with increasingly unequal access to work or education. Without understanding how the pattern of streets shapes and is shaped by social mechanisms, such problems are likely to remain entrenched.
Shaped by the city
While maps of segregation will typically capture a single aspect of social situation, such as race or nationality, it’s clear that economics, politics and – fundamentally – urban space itself will all have a role to play in shaping how an individual will be able to overcome their place in the city.
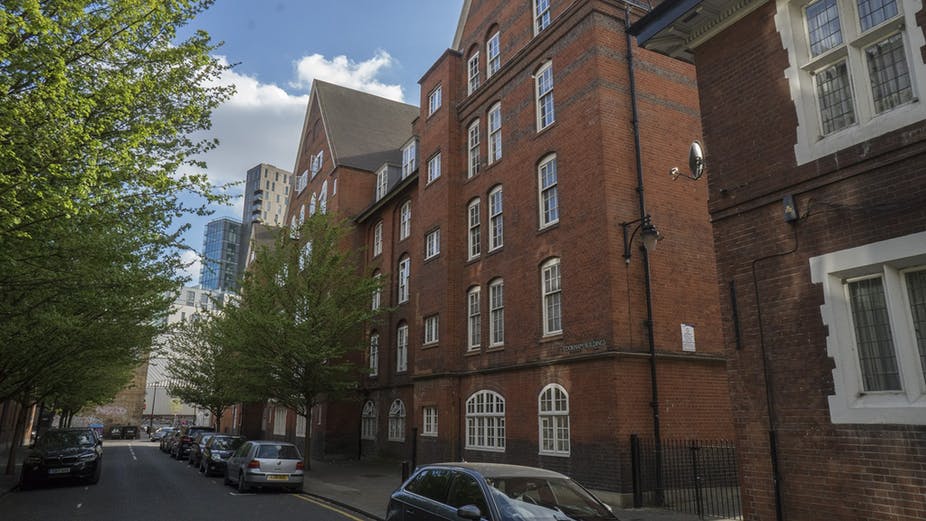
I have shown this to be the case in my study of the historic settlement patterns in London’s East End. Despite being known as the “ghetto”, it acted more like a machine for processing the long-term acculturation of the variety of immigrants that settled in the area, from Huguenot, to Irish, to Jewish, to Bengali. As they settled in the area, they formed networks of self-support and then – sometimes after one or more generations had passed – and moved out. The success of this process was bound up in the fact that the East End remains within reach of the economic heartland of the city, and that its porous structure means that local social networks can coexist with good connections across London.
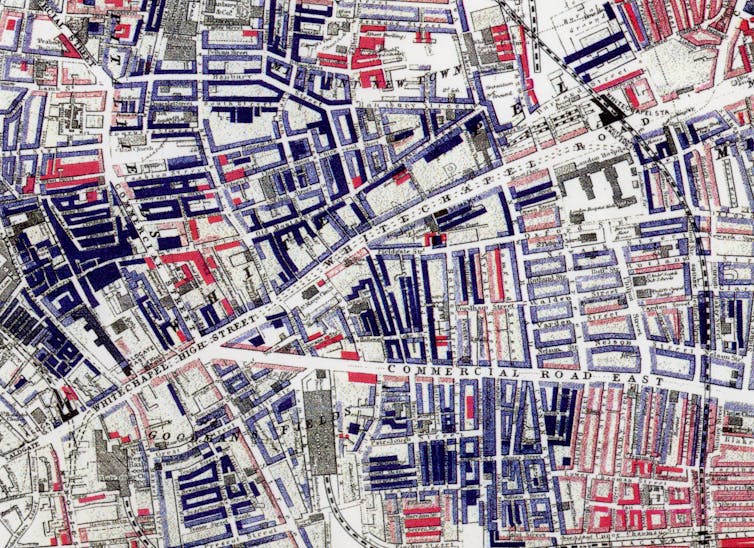
Sample area from George Arkell’s map of Jewish East London, 1899, published in The Jew in London, 1901. Streets coloured red had a Jewish minority and coloured blue, a Jewish majority. Image copyright Cornell University – PJ Mode Collection of Persuasive Cartography
The difficulty in easily changing the way in which neighbourhoods are laid out is one of the reasons why segregation can be so intractable. While some scholars have produced mathematical models that aim to forecast patterns of segregation, they have to contend with the almost impossible challenge in predicting the way people and society will behave in the future.
In the UK, the way in which housing is allocated can reinforce racial divides, especially among new immigrants from the developing world. Capturing statistics on ethnic minority marginalisation without assessing where people live, what their housing conditions are, or what opportunities they have to lift themselves out of poverty, means we lose much essential information that will help arrive at useful policy solutions.
Booth’s maps were able to create an informed basis for new legislation to alleviate the situation in large cities such as London. In addition to groundbreaking work on poverty in old age, Booth’s research influenced a number of building acts which were to transform the structure of housing in the Britain. I hope that similar forensic mapping of poverty and prosperity today might be used to audit the complexity of segregation – with equally transformative results.
 Laura Vaughan has received funding from the Engineering and Physical Sciences Research Council in connection with the research reported in this article.


