


 AUDJPY Bullish Momentum Pauses: Profit Booking Offers Fresh Entry Window Near 112.50
  FxWirePro- Woodies Pivot(Major)
  FxWirePro: GBP/NZD topside capped, sellers still hold the advantage
  FxWirePro- Woodies Pivot(Major)
  FxWirePro: USD/CAD recovers slightly but bearish outlook persists
  FxWirePro- Major Crypto levels and bias summary
  FxWirePro: USD/ZAR rebounds strongly, upside pressure builds
  FxWirePro -Major European Indices
  FxWirePro: USD/CNY recovers slightly from early decline but bears are not done yet
  FxWirePro: USD/ZAR uptrend resumes rise toward key fibo
  FxWirePro: GBP/USD drops towards 1.3350 level, heads deeper into bear territory
  Euro's Ascent: EURJPY Bulls Eye 186.00 as Yen Weakness Persists
  FxWirePro: AUD/USD softens slightly, but remains bid overall
  FxWirePro- Major European Indices
  FxWirePro: EUR/AUD falls below 1.6200 level, plunge to test a key fibo grows
  FxWirePro: USD/JPY edges up, remains on front foot


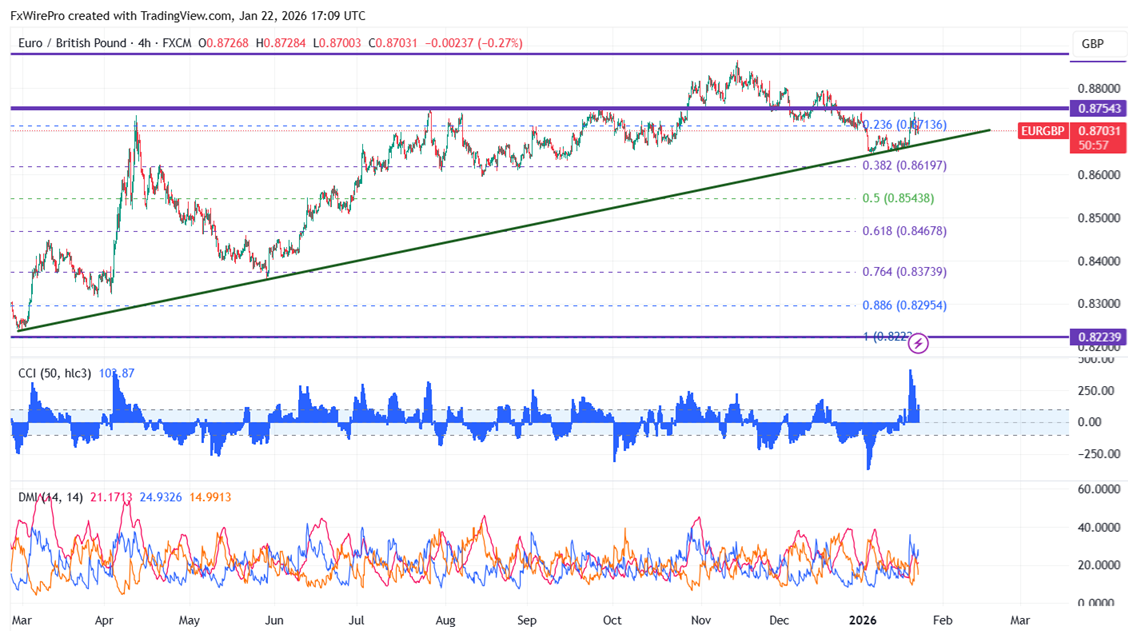
EURGBP has traded in a narrow range between 0.86447 and 0.87435 for the past two weeks. As long as support 0.8645 holds, intraday bias is bullish. Currently trading at 0.87014, it reached an intraday high of 0.87015.
Technical Analysis
The pair is currently trading below 55 and 200- EMA and 365-EMA on the 4-hour chart.
Bearish Trend Confirmation: Any break below 0.8640 confirms an intraday bearish trend. A drop to 0.8600/0.8540 is likely.
Near-Term Resistance: The near -term resistance is around 0.8750. Any violation above will take the pair to 0.8780/0.8825/0.8865/0.8900/0.8950.
Indicator Analysis (4-hour chart)
CCI (50): Bullish
Average Directional Movement Index: Bullish
Trading Recommendation
It is good to buy on dips around 0.8678-80 with SL around 0.8640 for a TP of 0.8800.


