


 Ethereum Retreats in Bitcoin’s Shadow: ETH/USD Tests Critical Support at USD 2,075
  FxWirePro- Major Crypto levels and bias summary
  Ethereum’s $2,200 Ceiling: Can Diplomatic Breakthroughs Dissolve the Bearish Resistance?
  Ethereum Steady Above USD 2,000: ETH Tracks Bitcoin’s Lead as Bulls Eye a USD 2,770 Breakout
  Bitcoin Reclaims USD 71,000 Milestone: Bullish Sentiment Resurges as Geopolitical Tensions Ease
  FxWirePro- Major Crypto levels and bias summary
  FxWirePro- Major Crypto levels and bias summary


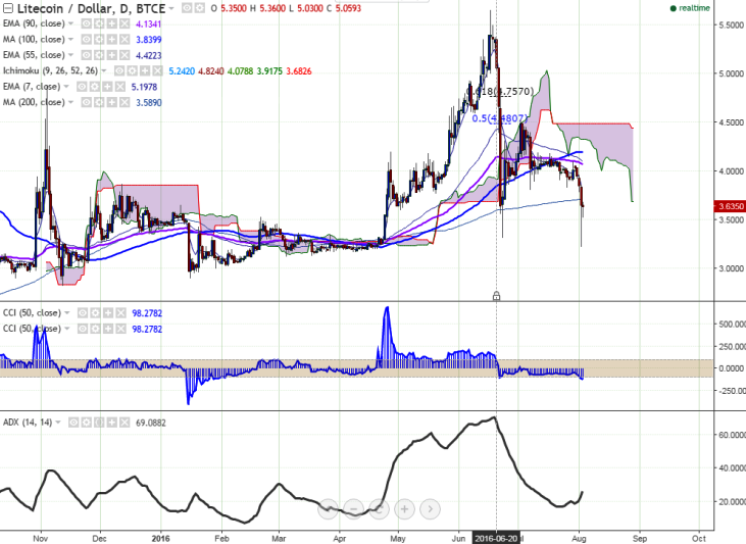
LTC/USD has recovered from the lows of 3.22 levels hit yesterday, however, it continues to trade well below 200 day MA. It is currently trading at 3.63 levels at the time of writing (BTC-e).
Ichimoku analysis of daily chart:
Tenkan Sen: 3.66
Kijun Sen: 3.70
Trend reversal: 3.70 (200 DMA)
On the upside, the pair faces major resistance at 3.70 levels (200 DMA) and a break above would target 4.07 levels (90 EMA)/4.53 (July 2 high). On the other hand, support is seen at 3.31 levels (June 23 low), and a break below would drag the pair to 3.22 levels (August 2 low)/3.15 (113% retracement of 3.31 and 4.53).

- News

- Economy

- Central Banks
- Investing
- Research
- Roundups
- Digital Currency
- Insights
- Technical Analysis
- Technology
- Business
- Law
- Health
- Nature
- Fintech
- Science
- Topic
- Opinions
- ©Econometrics LLC . All Rights Reserved.
LTC/USD trades well below 200 DMA, eyes 3.22
Wednesday, August 3, 2016 12:07 PM UTC
Editor's Picks


- Market Data
Most Popular


