


 Ethereum’s $2,200 Ceiling: Can Diplomatic Breakthroughs Dissolve the Bearish Resistance?
  Bitcoin Retreats Toward Critical Support as Geopolitical Winds Shift
  Ethereum Retreats in Bitcoin’s Shadow: ETH/USD Tests Critical Support at USD 2,075
  FxWirePro- Major Crypto levels and bias summary
  Ethereum Trails Bitcoin’s Retreat: Key Support Levels in Focus
  FxWirePro- Major Crypto levels and bias summary


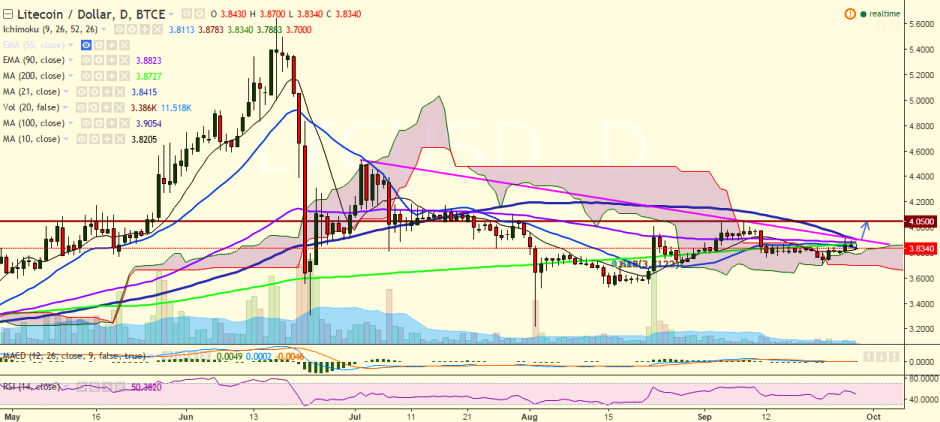
LTC/USD is struggling to close above 200-day MA and is currently trading at 3.83 levels (BTC-e).
Short-term trend: Bearish
Ichimoku analysis of daily chart:
Tenkan Sen: 3.81
Kijun Sen: 3.87
Trend reversal: 3.88 (90 EMA)
“On the upside, the pair is showing a slight dip after hitting 3.91 levels (the trend line joining 4.53 and 4.05) and any break above this level would take the pair to September 08 high of 4.05 levels”, FxWirePro said in a statement.
LTC/USD is facing a major resistance at 3.86 levels (200-day MA) and a break above would target 3.91 levels (September 26 high)/ 4.05 (September 8 high).
On the flipside, the pair might find support near 3.81 (10-day MA) and a break below would drag the pair to 3.70 levels (September 22 low)/3.50 (psychological level).

- News

- Economy

- Central Banks
- Investing
- Research
- Roundups
- Digital Currency
- Insights
- Technical Analysis
- Technology
- Business
- Law
- Health
- Nature
- Fintech
- Science
- Topic
- Opinions
- ©Econometrics LLC . All Rights Reserved.
LTC/USD trades weaker, bullishness only above 3.91
Wednesday, September 28, 2016 11:18 AM UTC
Editor's Picks


- Market Data
Most Popular


