


 FxWirePro- Major Crypto levels and bias summary
  Ethereum Steady Above USD 2,000: ETH Tracks Bitcoin’s Lead as Bulls Eye a USD 2,770 Breakout
  Bitcoin Retreats Toward Critical Support as Geopolitical Winds Shift
  BTCUSD Coils in Tight Range: Will Geopolitical Stability Trigger a Breakout Toward $80,000?
  FxWirePro- Major Crypto levels and bias summary
  Ethereum’s $2,200 Ceiling: Can Diplomatic Breakthroughs Dissolve the Bearish Resistance?
  Ethereum Trails Bitcoin’s Retreat: Key Support Levels in Focus


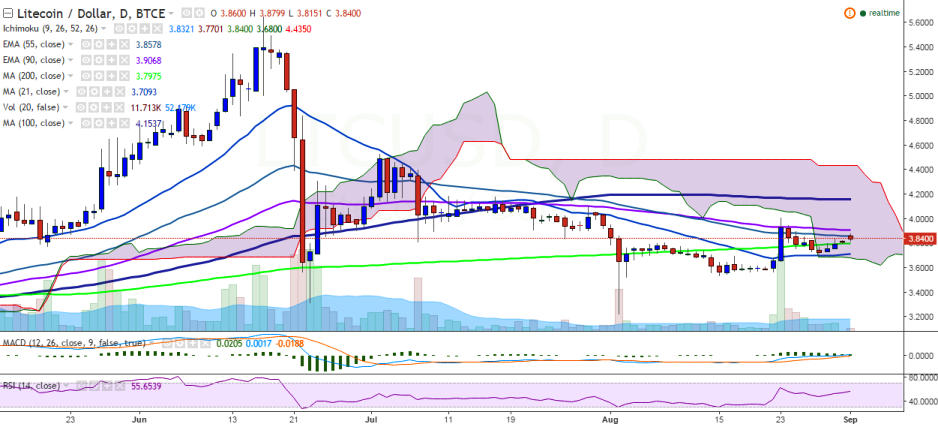
LTC/USD continued its upward trend on Thursday seen from the past couple of days and is currently hovering around 55 EMA at 3.84 levels (BTC-e).
Ichimoku analysis of daily chart:
Tenkan Sen: 3.82
Kijun Sen: 3.77
Trend reversal: 3.90 (90 EMA)
“After closing above 200-day MA on Wednesday, the pair moved further north today. LTC/USD should break above the temporary high of 4.01 levels seen on August 23 for further upside”, FxWirePro said in a statement.
The pair faces major resistance at 3.90 (90 EMA) and a break above would see the pair testing 4.00 (August 23 high)/4.19 (161.8% retracement of 4.01 and 3.71)/ 4.53 (July 02 high).
On the reverse side, support is seen at 3.79 (200-day MA) and a break below would target 3.70 (21-day MA)/3.50 (psychological level).

- News

- Economy

- Central Banks
- Investing
- Research
- Roundups
- Digital Currency
- Insights
- Technical Analysis
- Technology
- Business
- Law
- Health
- Nature
- Fintech
- Science
- Topic
- Opinions
- ©Econometrics LLC . All Rights Reserved.
LTC/USD heads north, break above 4.01 confirms further bullishness
Thursday, September 1, 2016 11:33 AM UTC
Editor's Picks


- Market Data
Most Popular


