


Market is reeling with risk aversion arising from China, which has pushed global stock market into a tailspin at the beginning of the year. Analysts and market participants are returning fast and volume increasing in the market as Chinese stock market plunge pushed global equities to shed off $2.5 trillion in value.
Stocks are red all across globe. Chinese stock market today hit circuit within half an hour of trading, and deducting 15 minutes trading halt, CSI 300 plunged 7% in just a matter of 14 minutes.
US cash market hasn't opened yet, however future is pointing to more than -2.3% plunge already.
However our recent historical analysis shows, Chinese stock market plunge over the last few years hasn't been major mover for US stock market.
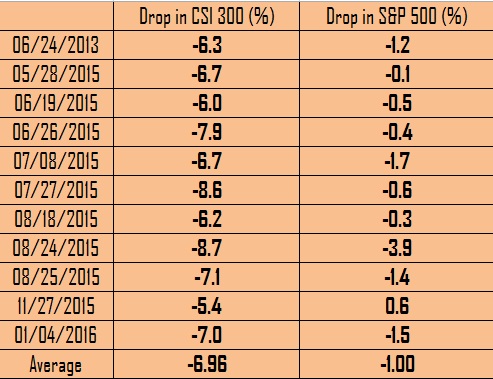
Since 2013 (excluding today's move) Chinese stock market has plummeted more than 5% on 11 occasions, averaging about 6.96% drop and average move in S&P 500 on those occasions has been merely a percent, with stock rising in only one occasions.
Biggest plunge has been on 24th August 2015, when Chinese stock market plunged -8.7% and S&P 500 followed with -3.9% drop.
This simple analysis puts us in the camp, the real risk aversion and selloffs might not be stemming from stock market plunge, which is known to be volatile. It is the Yuan and panic arising from circuit breaker system could largely be behind it.
S&P 500 CFD is currently at 1947.


