


 - EconoTimes)


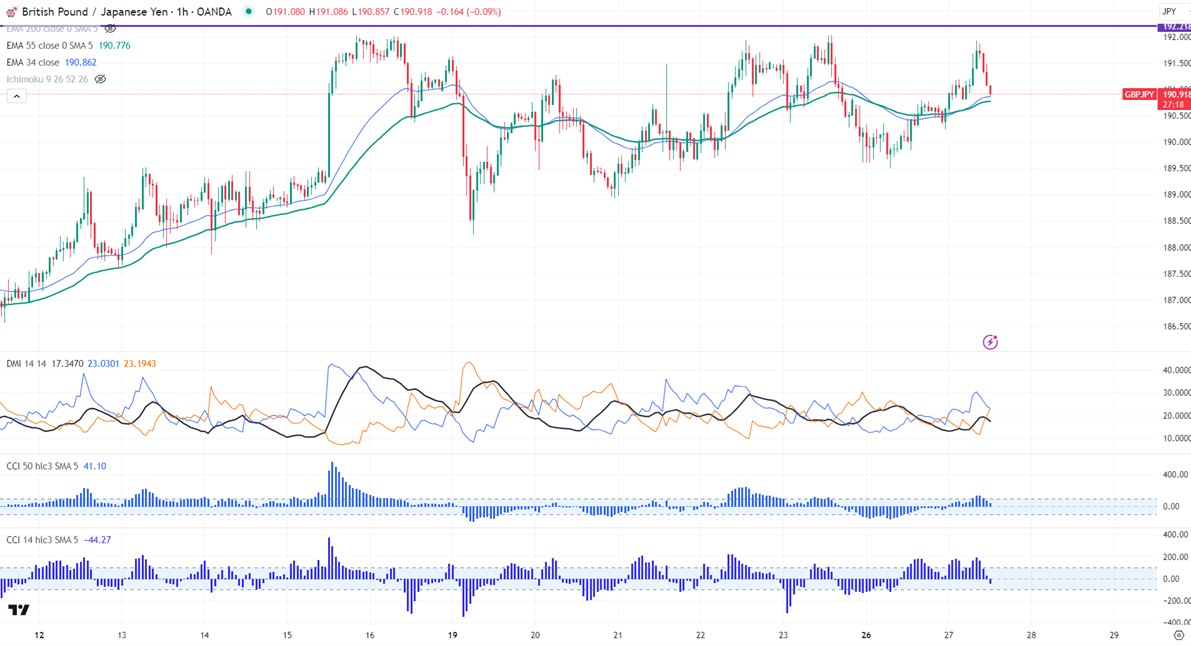
Chart pattern- Triple top around 192.
GBPJPY pared most of its gains made during the Asian session. It hit a high of 191.92 and is currently trading around 191.15.
Technicals-
The pair is trading above 34- and 55 EMA in the hourly chart.
The near-term resistance is around 191.20, a breach above targets 191.50/192. Major trend continuation only above 192.05. The immediate support is at 190.85 (34- H EMA), any violation below will drag the pair to 190.75 /190.50/190/189.48/188.90.
The pair should close below 190.75-85 for further weakness.
Indicator (hourly chart)
CCI (14)- Bearish
CCI (50)- Bullish (below 100)
Average directional movement Index - Neutral. All indicators confirm the mixed trend.
It is good to sell below 190.75 with SL around 191.20 for a TP of 189.51.


