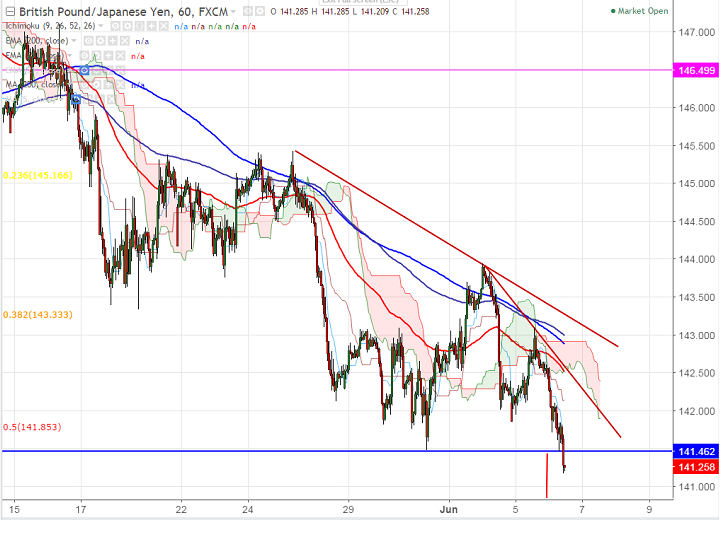
- GBP/JPY continues its losing streak after hitting high of 143.95 on Jun 2nd 2017. The pair broken temporary bottom around 141.48 on May 31st 2017. It is currently trading around 141.22.
- In the hourly chart the pair is trading well below Tenkan-Sen and Kijun-Sen and min or bullishness can be seen only above 142.28 (hourly Kijun-Sen). On the lower side, any break below temporary low confirms minor weakness, a decline till 140.37 (61.8% of 135.75 and 148.11)/138.50.
- The near term resistance is around 142.28 and any break above will take the pair till 143/143.95.
It is good to sell on rallies around 141.25-141.30 with SL around 142.05 for the TP of 140.37/139.


FxWirePro: USD/CNY hits 15-month low , scope for further downside
FxWirePro: EUR/AUD slips following RBA minutes , plunge to test a key fibo grows
FxWirePro: GBP/USD runs out of steam but maintains bullish outlook
FxWirePro- Major Pair levels and bias summary
FxWirePro: USD/ZAR down trend loses steam, remains on bearish path
FxWirePro: EUR/NZD set for bigger drop, but close below key fibo needed
CAD/JPY Holds Positive Bias Despite Canada’s Sharp GDP Contraction: Buy Dips Toward 116 Target
FxWirePro: EUR/NZD downside pressure builds, key support level in focus
USD/CHF Bears in Control: Dips Below 0.7870 Signal More Downside Ahead
EUR/GBP Holiday Slumber: Bearish Bias Intact Below 0.8800 Resistance
FxWirePro: USD/CAD outlook weaker on renewed downside pressure
FxWirePro- Major Pair levels and bias summary
FxWirePro: USD/ZAR outlook weaker on renewed downside pressure
FxWirePro: EUR/CAD extends fall, vulnerable to more downside
FxWirePro- Woodies Pivot(Major) 


