


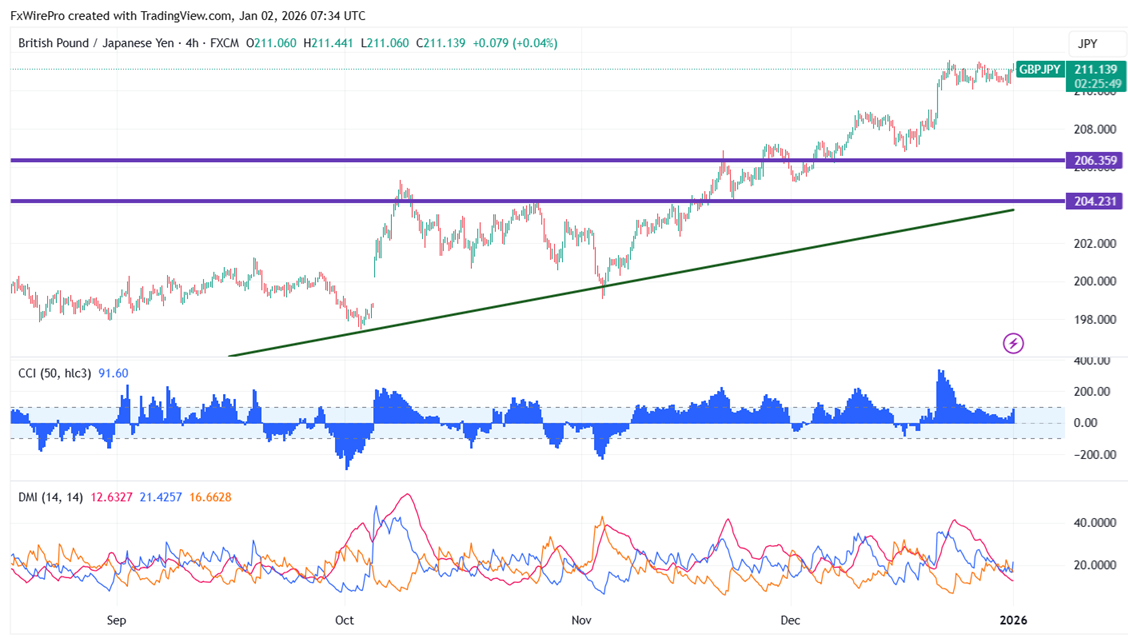
GBPJPY trades higher after taking support near the 210 level. As long as support 210 holds, the intraday trend is bullish. It is trading around 211.436, as of publication, and has reached an intraday high of 211.438.
Oscillators and moving averages to forecast the trend of GBPJPY
CMP- 211.42
EMA (4-hour chart)
55-EMA- 210.30
200-EMA- 207.76
365-EMA- 205.57. The pair trades above the short (55- EMA) and long-term moving average(365 EMA and below 200 EMA).
Major Support- 210. Any breach below will drag the pair down 209.70/209/208.60/207.95/207.20/206.75.
Major resistance - 211.60. Any break above confirms minor bullishness, a jump to 212/212.60/213 is possible.
Indicator (4-hour chart)
CCI (50)- Bullish
Average directional movement Index- Neutral. All indicators confirm a neutral trend.
It is good to buy on dips around 210 with SL around 209 for a TP of 212.


