


- Major resistance - 19500 ( trend line joining 19698 and 19535)
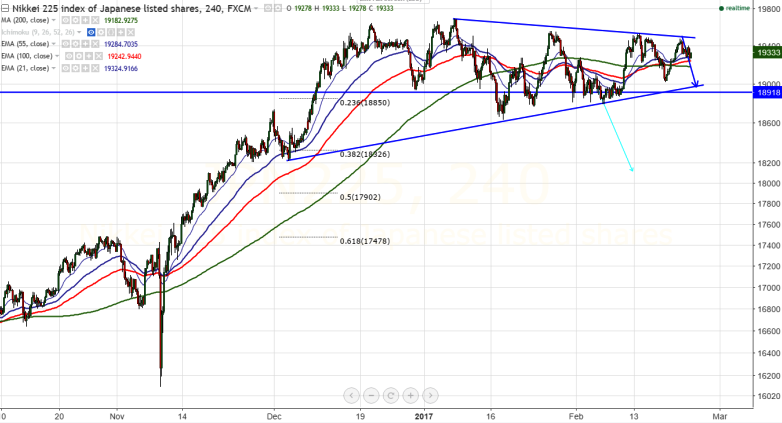
- Pattern formed - Symmetrical Triangle pattern
- Nikkei has formed symmetrical triangle pattern in the daily chart and any break above 19500 confirms bullish continuation.It is currently trading at 19333 0.03% lower.
- •The index retreated slightly from the high on account of minor weakness in USD/JPY and the pair has jumped till 113.73 yesterday and started to decline from that level.It is currently trading around 113.23.It's major resistance is around 115 and minor bullishness can be seen above that level.
• On the lower side ,19240 (100- 4 H EMA) is acting as next immediate support and any break below targets 19184 (200- 4H MA)/19026.
•The major weekly resistance is around 19500 (trend line resistance) and any break above will take the index till 19566/19698. The minor resistance is around 19390
It is good to sell on rallies around 19400-450 with SL around 19566 for the TP of 19170/19030.


