


 Aussie Strength Prevails: AUD/JPY Targets Multi-Year Highs as Bullish Momentum Builds
  FxWirePro: GBP/NZD down trend loses steam, remains on bearish path
  FxWirePro: GBP/USD rises as UK political uncertainty fails to dent pound strength
  FxWirePro- Major Crypto levels and bias summary
  FxWirePro: EUR/AUD momentum strongly bearish despite pause in losses
  FxWirePro: USD/JPY neutral in the near-term, scope for downward resumption
  FxWirePro: AUD/USD remains buoyant, looks to extend gains
  FxWirePro: USD/CAD gains some ground but bearish outlook persists
  CADJPY Outlook: Loonie Limps as Dismal Jobs Data Fuels BoC Rate Cut Bets
  FxWirePro: GBP/AUD edged higher but bearish outlook remains
  FxWirePro: GBP/NZD downtrend loses steam, remains on bearish path
  Ethereum Technical Outlook: ETH Braces for Support as Bulls Eye the USD 2,200 Buy Zone
  FxWirePro: GBP/USD eases slightly as investors focus on UK elections
  FxWirePro: USD/ZAR slips as rand gains on U.S.-Iran peace deal hopes
  NZDJPY Technical Outlook: Selling the Rallies as Bearish Momentum Consolidates
  FxWirePro- Major Pair levels and bias summary
  Bitcoin Targets USD 90,000: Bullish Sentiment Solidifies as Realized Profits Surge


Before proceeding further we would urge you to go through our previous write up on this pair by following below link:
http://www.econotimes.com/FxWirePro-Hanging-man-formation-signifies-NZD-JPYs-weakness-likely-to-retest-support-at-80250-110353
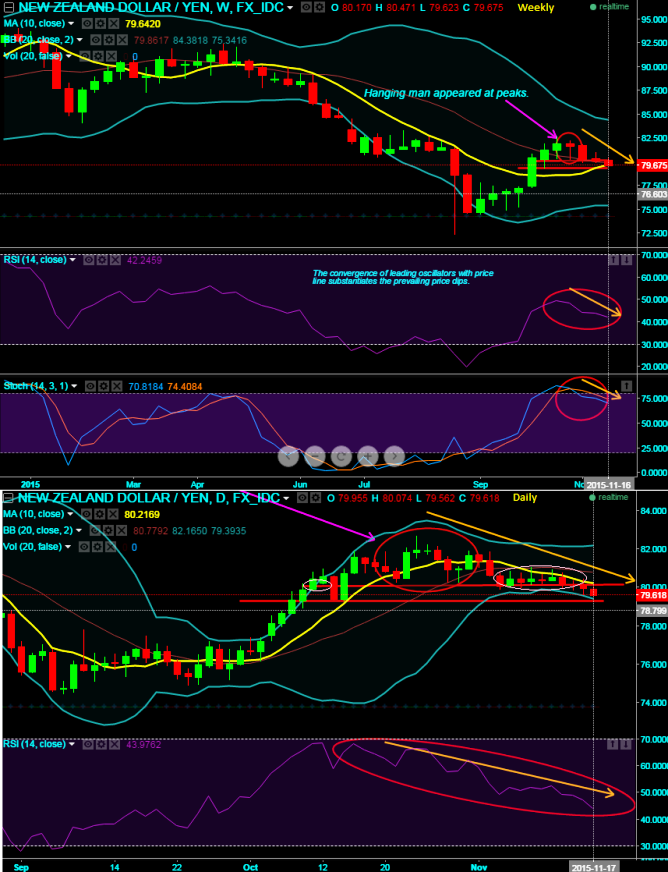
Now please be informed that the dips from then 81.440 to the current levels of 79.750 are just the mere effects of above explained bearish pattern.
For now the pair has breached important support zones of 80.250 and 80.150 on the daily charts which have not been able to break this level quite a lot times in the recent past (see circled areas for price valuation on historical evidences). We believe this has exposed the pair to head towards 79.275.
The pair rallied from 75.181 to 82.688, but does not manage to sustain previous crucial supports at 80.250 or 80.150 regions.
The formation of bearish patterns like hanging man and doji candles at 81.648 and 81.923 levels on weekly and daily charts respectively still signifies weakness at current juncture.
The RSI oscillator is clearly converging to the price dips this would also mean that selling pressures are piling up.
Subsequently, a clear %D crossover above 80's strengthens bears interests in the market, as a result we've seen weekly lows at 79.623 which is attempting to slip below 10DMA which is again one more bearish indication. However, closing basis should be closely monitored.

- News

- Economy

- Central Banks
- Investing
- Research
- Roundups
- Digital Currency
- Insights
- Technical Analysis
- Technology
- Business
- Law
- Health
- Nature
- Fintech
- Science
- Topic
- Opinions
- ©Econometrics LLC . All Rights Reserved.
FxWirePro: “NZD/JPY slumps” this is not astrology but a sheer research – next targets at 79.275
Tuesday, November 17, 2015 8:28 AM UTC
Editor's Picks


- Market Data
Most Popular


