


 FxWirePro- Major Crypto levels and bias summary
  FxWirePro: AUD/USD soften slightly but trend is still bullish
  FxWirePro: USD/CAD gains some momentum as weak Canadian jobs data weighs on loonie
  FxWirePro: USD/CNY hovers near three-year low, scope for further downside
  NZDJPY Technical Outlook: Selling the Rallies as Bearish Momentum Consolidates
  FxWirePro: NZD/USD loses momentum but bullish setup remains
  FxWirePro: USD/ZAR slips as rand gains on weaker dollar
  Trump’s Hardline Stance Rattles Markets: BTC/USD Faces Volatility but Technicals Signal Strength
  FxWirePro: GBP/NZD down trend loses steam, remains on bearish path
  FxWirePro: GBP/NZD downtrend loses steam, remains on bearish path
  CADJPY Outlook: Loonie Limps as Dismal Jobs Data Fuels BoC Rate Cut Bets
  FxWirePro: GBP/AUD edged higher but bearish outlook remains
  FxWirePro: GBP/AUD edged higher, set to stay on back foot
  AUDJPY Relief Rally: A Golden Opportunity for the Bears?
  Aussie Strength Prevails: AUD/JPY Targets Multi-Year Highs as Bullish Momentum Builds
  FxWirePro- Major Pair levels and bias summary


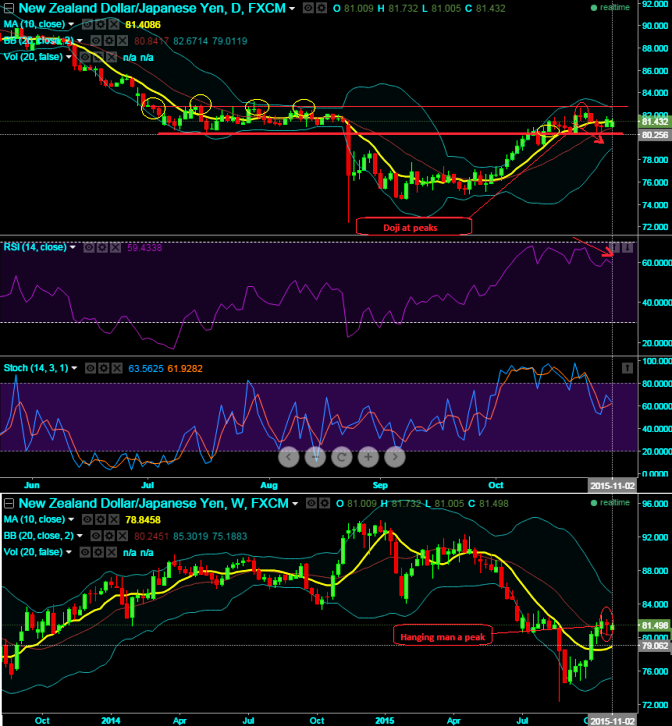
The pair rallied from 75.181 to 82.688, managed to sustain previous crucial supports at 80.250 resions but for now it is struggling to hold onto the resistance at 82.197 levels.
As shown on the daily charts, it has not been able to break this level quite a lot times in the recent past, and same does the support levels at 80.850, you can observe how the price behavior of this pair on either side after breaching this level in the recent historical evidences (see yellow circled areas).
More importantly, the formation of bearish patterns like hanging man and doji candles at 81.648 and 81.923 levels on weekly and daily charts respectively signifies weakness in previous rallies, looks like bulls have exhausted and given up.
The RSI oscillator has begun diverging at around 67 levels which is near overbought territory to the previous upswing rallies. This would mean that selling pressures are piling up.
Subsequently, %D crossover above 80's intensifies bears interests in the market, as a result we've seen today's lows at 81.005 to break the above support zone.
Intraday prices are attempting to slip below 10DMA which is again one more bearish indication. However, closing basis should be closely monitored.
If it does not manage to hold onto this level we could see near strong support only at 79.495 levels. Even if it shows upside potential we would still be safe but medium term it has to drop back.
Although we've been observing some bounces we could see with a dubious eyes on Kiwi fundamentals which are not that conducive and hence, we maintain long term bearish trend in our opinion.

- News

- Economy

- Central Banks
- Investing
- Research
- Roundups
- Digital Currency
- Insights
- Technical Analysis
- Technology
- Business
- Law
- Health
- Nature
- Fintech
- Science
- Topic
- Opinions
- ©Econometrics LLC . All Rights Reserved.
FxWirePro: Hanging man formation signifies NZD/JPY’s weakness, likely to retest support at 80.250
Monday, November 2, 2015 5:53 AM UTC
Editor's Picks


- Market Data
Most Popular


