


 FxWirePro: AUD/USD softens as Australian unemployment rate nears 5-year high
  Fed May Resume Rate Hikes: BofA Analysts Outline Key Scenarios
  FxWirePro- Major Pair levels and bias summary
  U.S. Stocks vs. Bonds: Are Diverging Valuations Signaling a Shift?
  Major Currency Score: EUR/USD, GBP/USD, AUD/USD & NZD/USD Extremely Bearish (-100); USD/CHF & USD/CAD Extremely Bullish (+100)
  Trump’s "Shock and Awe" Agenda: Executive Orders from Day One
  2025 Market Outlook: Key January Events to Watch
  FxWirePro- Major Pair levels and bias summary
  FxWirePro- Woodies Pivot (Major)
  AUDJPY Surges Amidst Yen Weakness, Key Resistance Ahead
  FxWirePro: USD/JPY firms as bearish yen sentiment persists
  Stock Futures Dip as Investors Await Key Payrolls Data
  FxWirePro: GBP/USD slides to three-month low, scope for further downside
  EURUSD Weakens as Dollar Strength Dominates; Technicals Suggest Sell-on-Rally Opportunity
  FxWirePro: GBP/NZD uptrend loses steam, remains on bullish path
  Gold Pares Gains Amidst Dollar Strength; Technicals Signal Sell-on-Rally Opportunity


 Add as a preferred source on Google
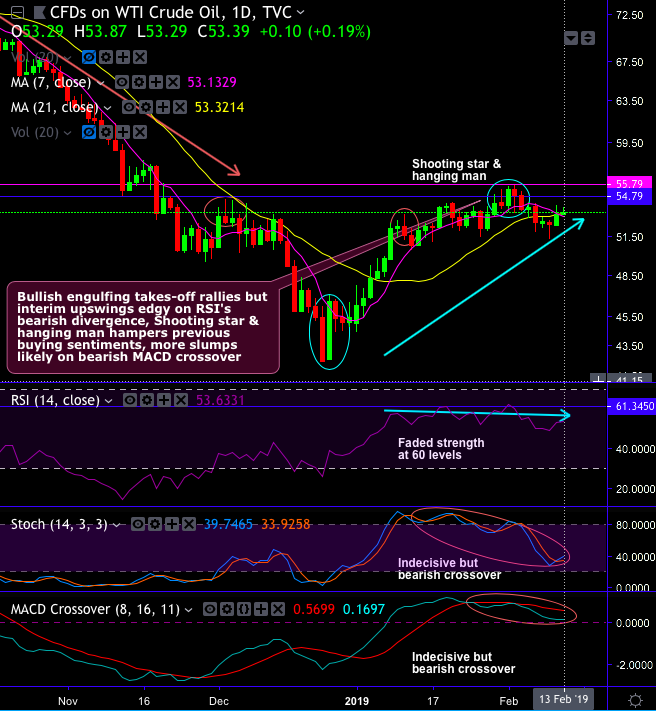
Technical Glance: On WTI crude daily chart, the recent rallies have bounced above 7DMAs upon the formation of bullish engulfing pattern at $46.57 levels but were restrained below stiff resistance zone of $54.79 - $55.79 levels as shooting star and hanging man pop up at this juncture that indicates weakness (refer daily chart).
As a result, the minor uptrend now seems to have been exhausted as RSI has also been showing divergence which is a bearish indication. For now, more slumps seem to be likely on bearish MACD crossover.
While on a broader perspective, Please be noted that on monthly terms, steep slumps are observed well below EMAs as the formation of 3-black crow patterns is completed at $45.40 levels, ever since the failure swings at stiff resistance of $76.29 levels, bears have managed to constantly nudge prices below EMAs and retrace more than 61.8% Fibonacci levels are observed.
Hammer has occurred at $53.98 levels, although we could see some abrupt rallies in last month, both the leading & lagging indicators still signal weakness (refer monthly plotting).
For now, more weakness is foreseen on this timeframe, as well as both leading oscillators (RSI & stochastic curves) indicate faded strength in the previous consolidation phase and intensified selling momentum in the current bearish trend. While lagging indicators (EMA & MACD crossovers) also signal downtrend continuation.
Overall, hammer at $53.98 levels may have shown the rallies above DMAs, but the major trend still remains edgy.
Trading Recommendations: The OPEC and EIA report today are most likely to provide fresh impetus for crude oil’s directional move. The production monthly report published last week reported an increase in US crude production by 1.8mbd YoY and 345kbd MoM.
On daily trading grounds, at spot reference: $53.36 levels, we advocate constructing tunnel spread ahead of EIA inventory check, using upper strikes at $54.79 and lower strikes at $52.28 levels. The strategy is likely to fetch leveraged yields as long as the underlying price keeps dipping but remains above lower strikes on the expiration.
Currency Strength Index: FxWirePro's hourly EUR is at -85 (bearish), while USD is inching at 104 (which is bullish), at press time 13:34 GMT.
For more details on the index, please refer below weblink: http://www.fxwirepro.com/currencyindex







