


USOIL chart - Trading View
Technical Analysis: Bias Turning Bearish
- US Oil trades weaker for the second straight session
- Price action has slipped below 5-DMA, is on track to test 21-EMA at 57.13
- Stochs and RSI are on verge of rollback from overbought levels
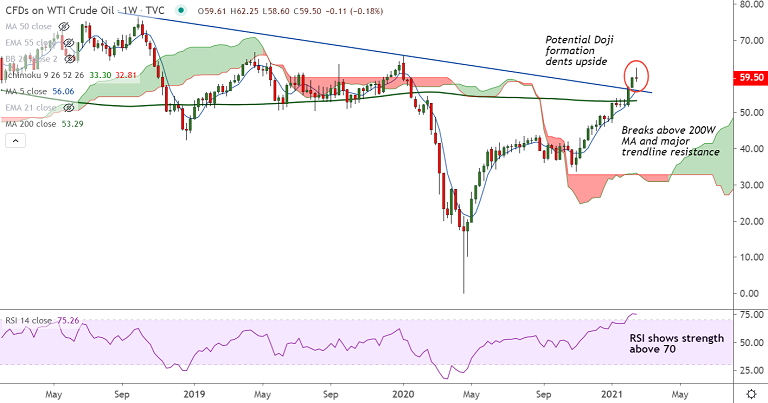
- Potential Doji formation on the weekly charts dents upside
- 200H MA is offering support on the intraday charts, break below will drag prices lower
Support levels - 59.36 (200H MA), 57.13 (21-EMA), 56.07 (5W MA)
Resistance levels - 65.62 (Jan 2020 high), 66.58 (April 2019 high), 69.52 (200W MA)
Summary: US Oil slips lower on account of extreme overbought conditions. Downbeat inventory numbers to keep downside cushioned. As per the latest inventory data from the US Energy Information Administration (EIA), US Crude Oil Stocks dropped below -2.429M forecast to -7.258M for the week ended on February 12. Technical bias is still bullish. Bullish invalidation likely below 21-EMA.


