


Ichimoku analysis (1Hour Chart)
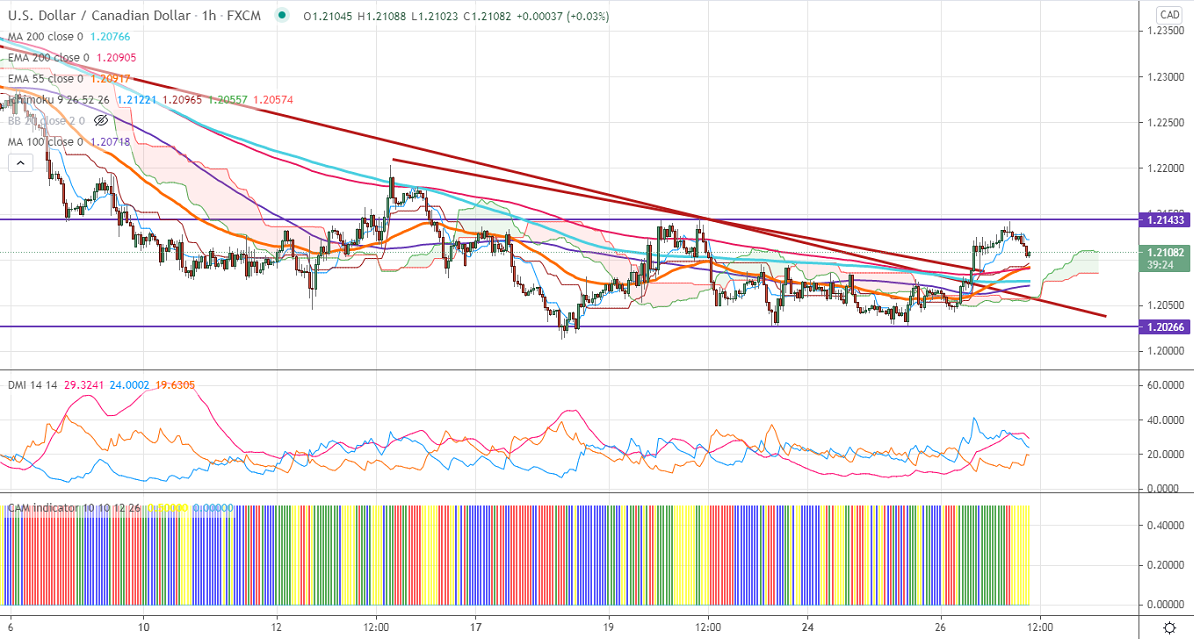
Tenken-Sen- 1.2122
Kijun-Sen- 1.20943
USDCAD has formed double bottom around 1.2030 and shown a nice recovery of more than 100 pips. The Canadian dollar was one of the best performers in the past six months on surge commodity prices and upbeat market sentiment. It hits a multi-year low at 1.20129 and is currently trading around 1.21034. Market eye US Durable foods order, Prelim GDP data for further direction.
WTI crude oil jumped to $66.33 after a positive EIA inventory. According to Energy Information Administration (EIA), the crude inventories fell by 1.7 million barrels in the week ended May 21st compared to a forecast of -1 M decline. The short-term trend is bullish as long as support $63 holds.
Technically, the pair faces near-term resistance at 1.2150. Any indicative break above will take till 1.21850/1.22031(May 13th high). Minor trend continuation only above 1.2205. The significant support is around 1.2040. Any violation below will take to the next level to 1.2000/1.1970/1.1950.
Indicator (4-hour chart)
CAM indicator – Neutral
D4irectional movement index –Neutral
It is good to buy on dips 1.2080 with SL around 1.2040 for a TP of 1.2180.


