


- USD/ZAR is currently trading around 12.95 levels.
- It made intraday high at 12.96 and low at 12.88 levels.
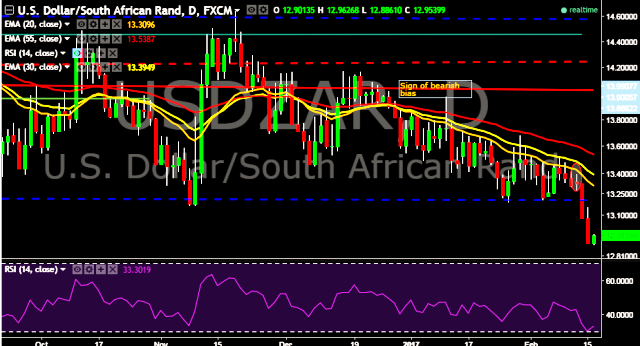
- Intraday bias remains bearish for the moment.
- A daily close above 12.90 will take the parity higher towards key resistances around 13.15, 13.43, 13.50, 13.59, 13.65, 13.77, 13.85, 13.96, 14.16, 14.29, 14.50, 14.75, 14.96, 15.05, 15.28, 15.45, 15.66, 15.77, 15.86 (February 29, 2016 high) and 16.15 marks respectively.
- Alternatively, a daily close below 12.90 will drag the parity down towards key supports at 12.70 and12.58 levels respectively.
- Important to note here that 20D, 30D and 55D EMA heads down and confirms the bearish trend in a daily chart.
We prefer to go short on USD/ZAR around 13.00, stop loss at 13.15 and target of 12.70.


