


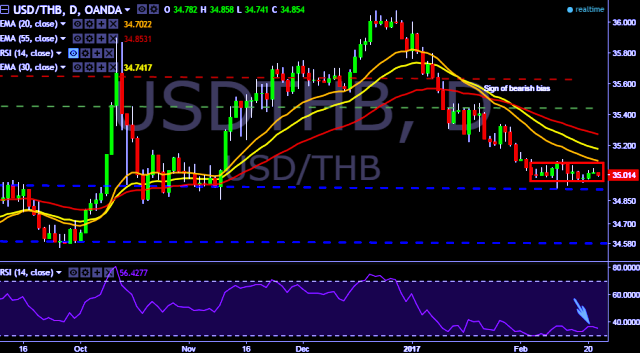
- USD/THB is currently trading around 35.01 marks.
- It made intraday high at 35.03 and low at 35.00 marks.
- Intraday bias remains neutral till the time pair holds immediate support at 34.99 marks.
- On the top side key resistances are seen at 35.11, 35.21, 35.33, 35.41, 35.67, 35.74, 35.84, 35.93, 36.01, 36.08 and 36.39 marks respectively.
- Alternatively, a daily close below 34.99 will drag the parity down towards key supports around 34.85, 34.64, 34.51 and 34.20 marks respectively.
- Important to note here that 20D, 30D and 55D EMA heads down and confirms the bearish trend in a daily chart. Current upside movement is short term trend correction only.
Positioning is inconclusive at this point, with prices offering no clear cut signal to initiate a long or short trade. We will continue to remain on sidelines for the time being.


