


USD/JPY saw an initial pop higher on Chinese Q4 2015 GDP data, which came in line with expectations at 6.8%.
- But the bounce was quickly faded as aggressive round of selling in both Shanghai and Nikkei 225 weighed on risk sentiment.
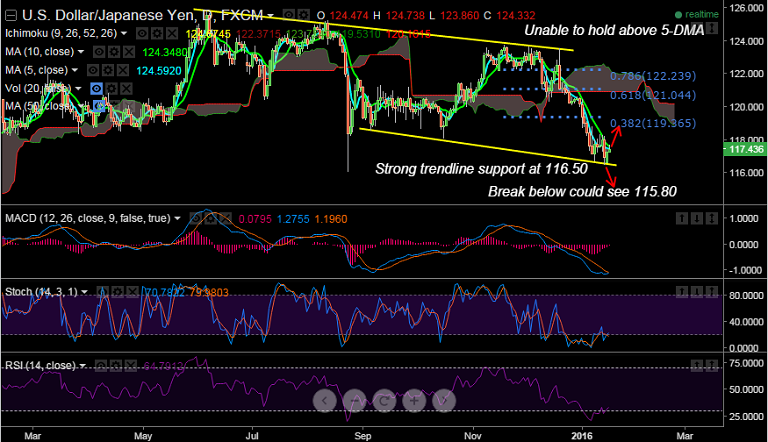
- Technical indicators lack directional strength, Stochs and RSI are in oversold territory but do not show buy signals.
- The pair unable to hold above 5-DMA at 117.45, is currently trading at 177.38, day's range for the pair till now 117.70/23, with 117.45 (5-DMA) and 116.50 (Trendline support) as immediate resistance and support.
We would wait for confirmation to go long:
-Break above 5-DMA at 117.50
- Stochs and RSI rollover from oversold territory
- Positive MACD line crossover on signal line
On the flipside, if the pair breaks below 116.50, then we would go short for 115.80 levels.
Resistance Levels:
R1: 117.45 (5-DMA)
R2: 117.60 (10-DMA)
R3: 118.07 (Jan 12 highs)
Support Levels:
S1: 116.50 (Trendline support)
S2: 116.08 (Aug 24th lows)
S3: 115.85 (Jan 16th lows)


