


USD/JPY chart - Trading View
- USD/JPY is extending downside on the day, in sync with weakness in US Treasury yields.
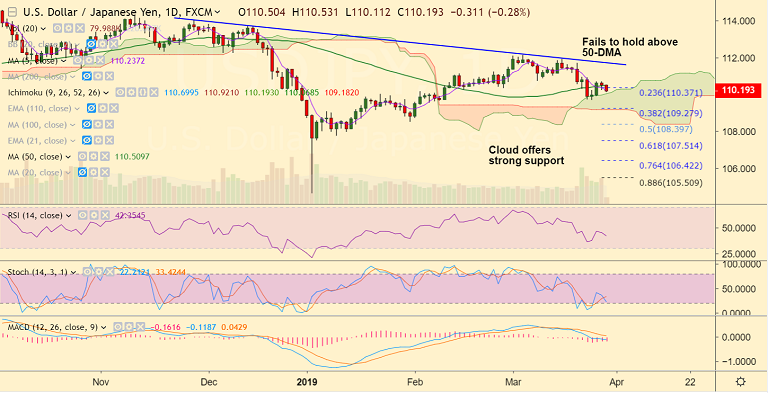
- The major is trading at 110.16, down from session highs at 110.53, down 0.31% at 0345 GMT.
- The sell-off in Treasury yields gained traction in the Asian trades, as risk-off remains at full steam.
- Comments overnight from the to-be Fed Governor, Stephen Moore, also weighed on investor sentiment.
- Technical studies are tilted towards the downside, price action below major moving averages.
- The pair failed to hold break above 50-DMA and now is testing support at daily cloud.
- Break below cloud top will see extension of weakness. Dip till 38.2% Fib at 109.27 then likely.
- Focus will be on updates from the two-day Beijing visit of the US delegates and the US Q4 GDP’s final version.
- Markets expect 2.4% growth figure for the annualized gross domestic product during the fourth quarter against 2.6% in Q3.
Support levels - 110.06 (cloud top), 109.70 (Mar 25 low), 109.27 (38.2% Fib)
Resistance levels - 110.23 (5-DMA), 110.50 (50-DMA), 110.78 (55-EMA)
Recommendation: Go short on break below cloud top, SL: 110.50, TP: 109.70/ 109.30
For details on FxWirePro's Currency Strength Index, visit http://www.fxwirepro.com/currencyindex.


