


Chart - Courtesy Trading View
Spot Analysis:
USD/JPY was trading 0.22% lower on the day at 133.85 at around 06:05 GMT.
Previous Week's High/ Low: 132.90/ 129.79
Previous Session's High/ Low: 134.35/ 132.54
Fundamental Overview:
Japan January trade deficit improved to ¥-3,496.6B versus ¥-3,871.5B expected and ¥-1,451.8B prior (revised).
Exports grew 3.5% versus 0.8% expected and 11.5% previous readings while the Imports eased to 17.8% versus 18.4% market forecasts and 20.7% prior.
Elsewhere, Japan’s Machinery Orders rose by 1.6% MoM versus 3.0% expected and -8.3% prior.
Upbeat Japanese trade data stoked fresh calls for hawkish moves from the Bank of Japan (BoJ).
On the other side, Data released on Wednesday showed US Retail Sales growth jumped to 3.0% YoY in January versus 1.8% expected and -1.1% prior. Core Retail Sales grew by 2.3%, beating estimates of +0.8%.
Further, NY Empire State Manufacturing Index for February improved to a three-month high of -5.8 versus -18.0 expected and -32.9 market forecasts. While, US Industrial Production came in at 0.0% MoM for January, missing estimates of 0.5% and -0.7% prior.
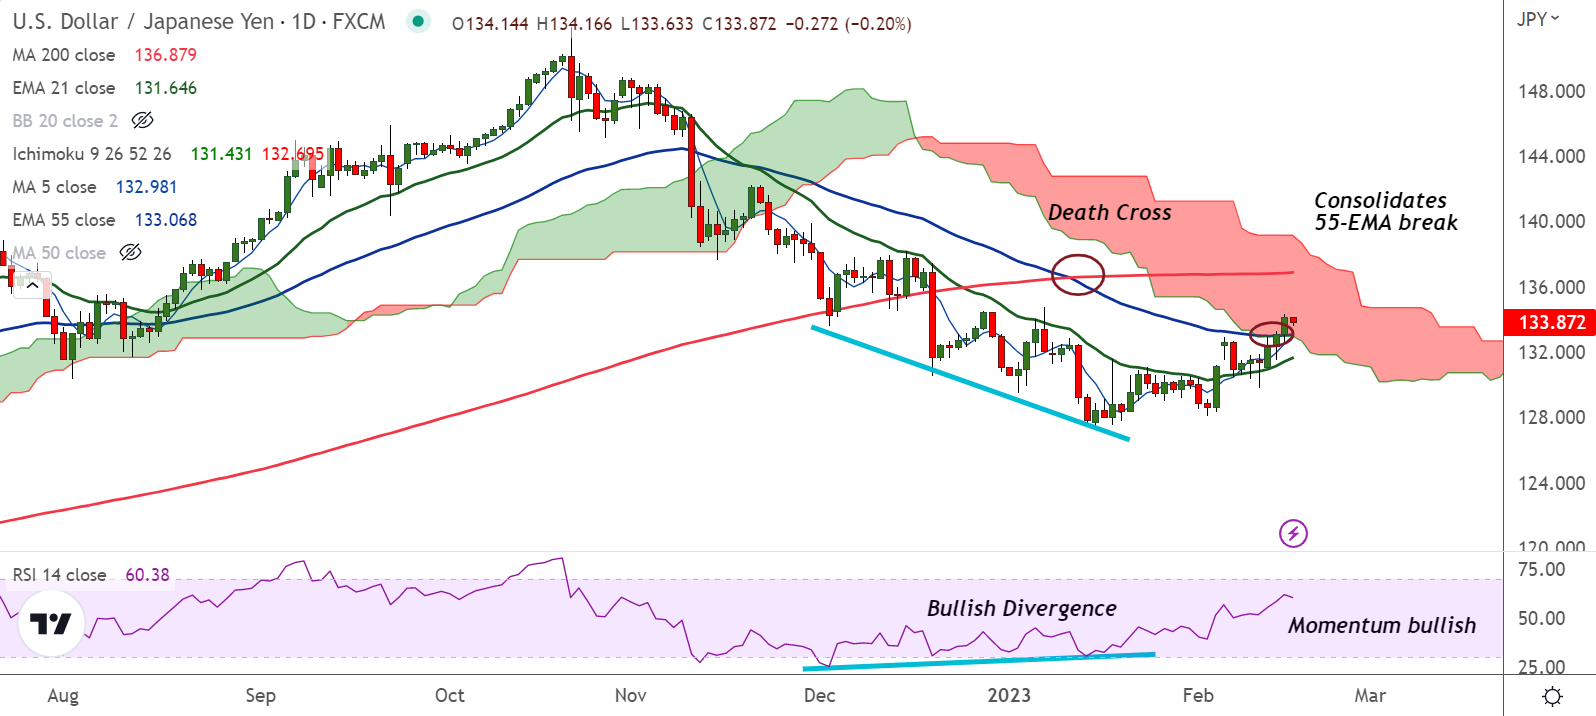
Technical Analysis:
- USD/JPY has shown a decisive break above 55-EMA and cloud base
- Momentum is bullish and volatility is high and rising
- MACD and ADX support further gains in the pair
- GMMA indicator shows minor trend has turned bullish on the daily charts
Major Support and Resistance Levels:
Support - 133.06 (55-EMA), Resistance - 134.87 (110-EMA)
Summary: USD/JPY has closed above 55-EMA and cloud base raising scope for further upside. Technical bias is bullish. Next immediate bull target lies at 110-EMA at 134.87 ahead of 200-DMA at 136.87.


