


USD/JPY chart - Trading View
USD/JPY slumped over 0.40% on the day and was trading at 106.40 at around 05:50 GMT.
Risk-aversion intensifies across markets, major Asian equity indices like Nikkei, Kospi, and Hang Seng are trading in the red.
Beijing said on Thursday that the US' decision to close the Chinese consulate in Houston this week has severely harmed relations and warned of retaliation.
Further, dismal weekly jobless claims data released Thursday have heightened concerns regarding the health of the world's largest economy.
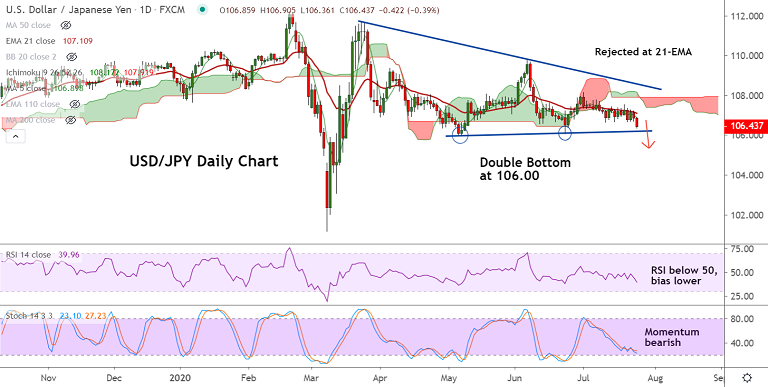
The pair has failed at stiff resistance at 21-EMA and technical indicators have turned bearish.
Major and minor trend on the weekly charts are strongly bearish. Volatility is rising and oscillators are biased lower.
Strong support is seen at 'Double Bottom' at 106. Breach below will open downside in the pair. Little support then till lower W BB at 105.65.
On the flipside, 21-EMA is stiff resistance at 107.10. Break above could see minor upside. Bearish invalidation only above 200-DMA.
Major Support Levels:
S1: 106 (Double Bottom)
S2: 105.65 (Lower W BB)
S3: 105 (Psychological mark)
Major Resistance Levels:
R1: 106.89 (5-DMA)
R2: 107.10 (21-EMA)
R3: 107.58 (21W EMA)
Summary: USD/JPY has turned bearish in the near-term. Weakness to accentuate if pair breaches 'Double Bottom' at 106.


