


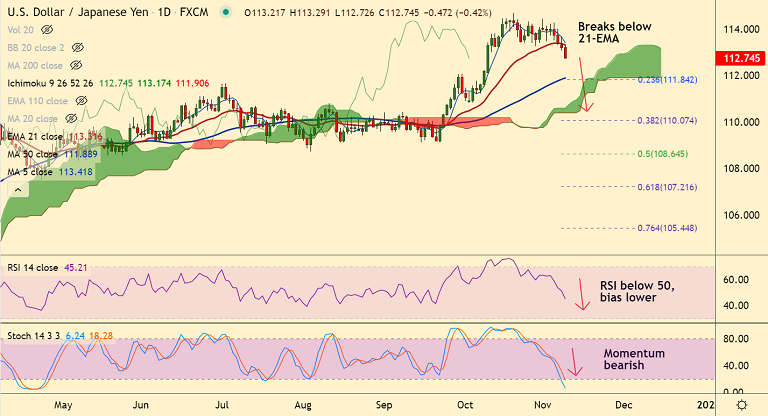
USD/JPY chart - Trading View
USD/JPY stands on slippery ground near 112.75 on downbeat Treasury yields. The major was trading 0.40% lower on the day at around 05:35 GMT.
Fears concerning the US Federal Reserve’s (Fed) tapering and anxiety over the Fed reshuffle seem to exert a great deal of pressure on the market sentiment supporting the yen.
Price action has breached 21-EMA support, and has tested fresh 4-week lows, outlook bearish.
Technical indicators are bearish, Stochs and RSI are sharply lower, momentum is strongly bearish.
Price action is below 200H MA, GMMA indicator shows near-term moving averages have turned bearish on the daily charts.
MACD supports downside. -ve DMI crossover on +ve DMI adds to the downside bias. Volatility is rising as evidenced by widening Bollinger bands.
Focus on US inflation data (due Wednesday). Analysts expect consumer price at 5.8% year-on-year, supporting the Federal Reserve's intent to be patient with interest rate hikes.
Major Support Levels:
S1: 112.20 (55-EMA)
S2: 111.89 (50-DMA)
S3: 111.10 (110-EMA)
Major Resistance Levels:
R1: 113
R2: 113.31 (21-EMA)
R3: 113.42 (5-DMA)
Summary: USD/JPY on track for further weakness. Dip till 55-EMA at 112.20 likely.


