


USD/JPY chart - Trading View
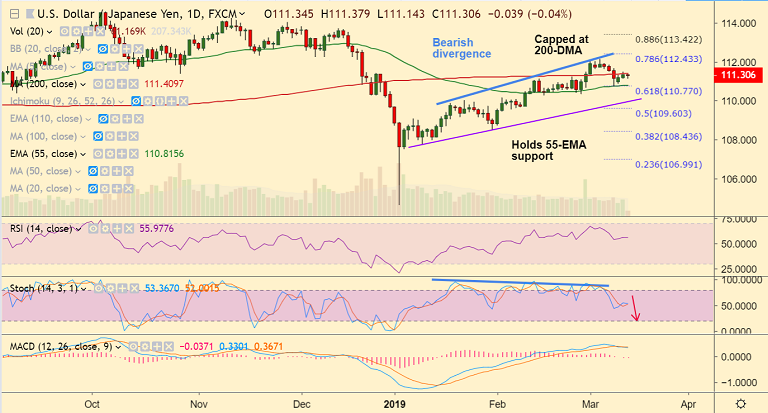
- USD/JPY is trading in a narrow range, capped below 200-DMA.
- US dollar weighed down by softer US consumer inflation figures. While fresh Brexit jitters underpinned the Japanese Yen's safe-haven demand.
- Data overnight showed U.S. the headline CPI came in at a 0.2% m/m rise in Feb, while the yearly rate eased further to 1.5%, missing forecasts for an unchanged reading.
- Downside is limited with a pickup in the prevalent positive tone around the US Treasury bond yields.
- The broader market risk-sentiment will remain the main driver for price action.
- Technical outlook on the daily charts remains neutral. Break below 55-EMA at 110.81 will increase the bearish bias.
- Bearish divergence and rollover of Stochs from overbought levels keeps scope for downside.
- Break below 55-EMA will see dip till 110 level. Retrace above 200-DMA will see test of 78.6% Fib.
Support levels - 111.06 (21-EMA), 110.81 (55-EMA), 110 (trendline)
Resistance levels - 111.40 (200-DMA), 112.06 (Upper BB), 112.43 (78.6% Fib)
For details on FxWirePro's Currency Strength Index, visit http://www.fxwirepro.com/currencyindex.


