


USD/JPY chart - Trading View
- USD/JPY opened the week's trade with a bullish gap-up, hit session highs at 111.18 before paring some gains to currently trade at 111.02.
- The major buoyed by risk-on in the markets on hopes that the United States and China would reach an agreement on trade as early as this month.
- Yen also weakness after Japan's business confidence worsened to a two-year low in the March quarter, as shown by the Bank of Japan's "tankan" survey on Monday.
- Markets largely ignore positive PMI data. Japan’s Nikkei and IHS Markit manufacturing purchasing managers’ index for March rose to 49.2 from 48.9 in February, helped by a lift in new orders.
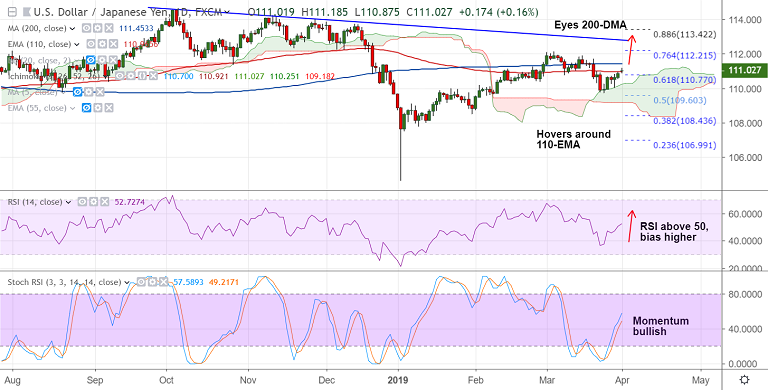
- Technical indicators are biased higher. RSI above 50, bias higher. Stochs show bullish momentum.
- Price action has bounced off daily cloud and is currently hovering around 110-EMA. Decisive break above eyes 200-DMA at 111.45.
- Breakout at 200-DMA could see test of 76.4% Fib at 112.21. Break below cloud negates any near-term upside.
Support levels - 110.96 (110-EMA), 110.72 (5-DMA), 110.25 (cloud top)
Resistance levels - 111.45 (200-DMA), 112, 112.21 (76.4% Fib)
For details on FxWirePro's Currency Strength Index, visit http://www.fxwirepro.com/currencyindex.


