


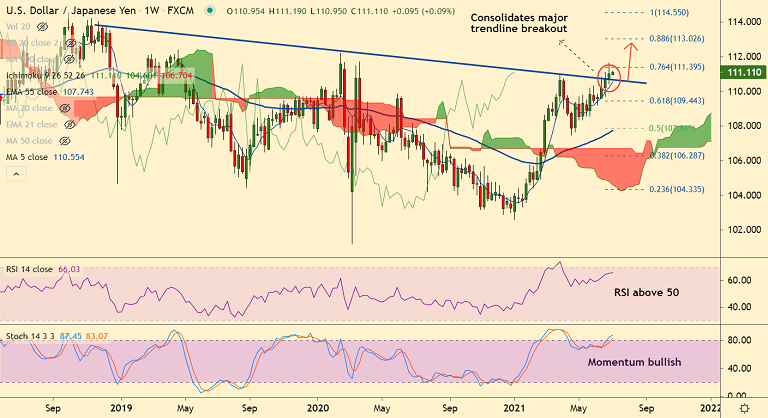
USD/JPY chart - Trading View
Spot Analysis:
USD/JPY was trading 0.09% higher on the day at 111.11 at around 05:45 GMT.
Previous Week's High/ Low: 111.65/ 110.41
Previous Session's High/ Low: 111.65/ 110.95
Fundamental Overview:
The US dollar was hammered on Friday's session on mixed economic data. The NFP data came at 850K, beating the market expectations at 700K.
The Unemployment rate came slightly higher at 5.9%. While the US Factory Orders jumped 1.7% in May, slightly above the market expectations.
Focus now on the FOMC Minutes from the June meeting due Wednesday for insight on the policymaker’s view on the economic and inflation outlook.
Technical Analysis:
- Bearish engulfing on Friday's candle dents upside
- Price action has slipped below 5-DMA
- Formation of a spinning top on the previous week's candle raises scope for some weakness
- The pair is consolidating breakout above trendline resistance on the previous week's chart
Major Support and Resistance Levels:
Support - 110.70 (Trendline support), 110.46 (21-EMA), 109.69 (55-EMA)
Resistance - 111.00 (5-DMA), 111.57 (Upper BB), 112.22 (Feb 2020 high)
Summary: USD/JPY ignores spinning top on the previous week's candle, extends gains for the 5th straight week. Bias higher as long as pair holds above trendline support. Scope for test of 112 mark.


