


USD/JPY chart - Trading View
Technical Analysis: Bias Bullish
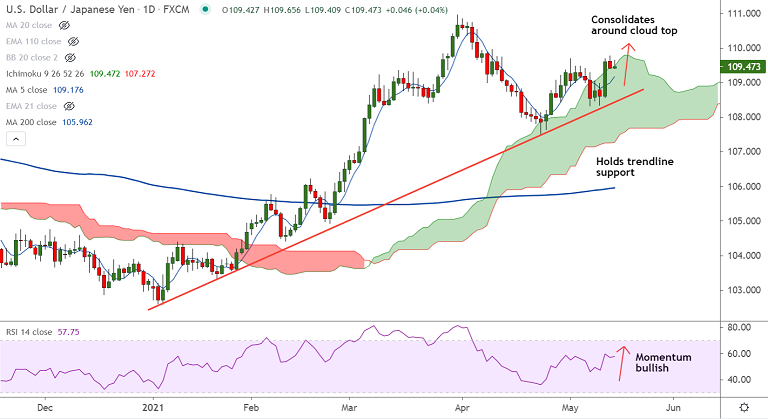
- USD/JPY was trading 0.10% higher on the day at 109.53 at around 05:10 GMT
- The pair is extending consolidation around cloud top, bias bullish
- GMMA indicator shows major and minor trend are strongly bullish
- Momentum indicators are bullish, Stochs and RSI are sharply higher
- Price action is above major moving averages, 5-DMA is biased higher
- Volatility is high and rising as evidenced by widening Bollinger bands
Support levels - 109.18 (5-DMA), 108.99 (21-EMA), 108.73 (20-DMA)
Resistance levels - 109.84 (Upper BB), 110, 110.84 (April high)
Summary: USD/JPY consolidates above 109 mark. The pair is grinding sideways along cloud top, bias remains bullish. Scope for upside resumption. Bullish invalidation only below 55-EMA.


