


 Oil Prices Dip Slightly Amid Focus on Russian Sanctions and U.S. Inflation Data
  Trump’s "Shock and Awe" Agenda: Executive Orders from Day One
  Gold Prices Fall Amid Rate Jitters; Copper Steady as China Stimulus Eyed
  China's Refining Industry Faces Major Shakeup Amid Challenges
  Gold Prices Slide as Rate Cut Prospects Diminish; Copper Gains on China Stimulus Hopes
  Mexico's Undervalued Equity Market Offers Long-Term Investment Potential
  Urban studies: Doing research when every city is different
  European Stocks Rally on Chinese Growth and Mining Merger Speculation


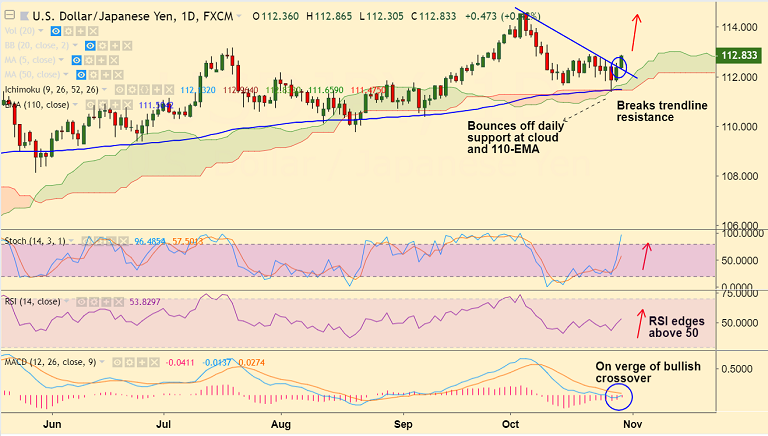
USD/JPY chart on Trading View used for analysis
- USD/JPY is extending positive momentum for the second straight sesson, bias higher.
- The pair is trading 0.42% higher on the day at 112.83 at the time of writing.
- Price action saw a solid rebound at the start of a new trading week, bounced of strong support at nearly converged daily cloud and 110-EMA.
- Stochs and RSI have turned higher and the major has broken strong trendline resistance at 112.35.
- Next immediate resistance lies at 113.17 (July 19 high) ahead of 114.55 (Oct 4 high).
- Failure to close above 20-DMA could see some flat trade. Retrace below 5-DMA to see further weakness.
Support levels - 112.48 (21-EMA), 112.15 (55-EMA), 111.50 (110-EMA)
Resistance levels - 113, 113.17 (July 19 high), 114.55 (Oct 4 high)
Recommendation: Good to go long on dips, SL: 112.30, TP: 113/ 113.15/ 114
For details on FxWirePro's Currency Strength Index, visit http://www.fxwirepro.com/currencyindex.


