


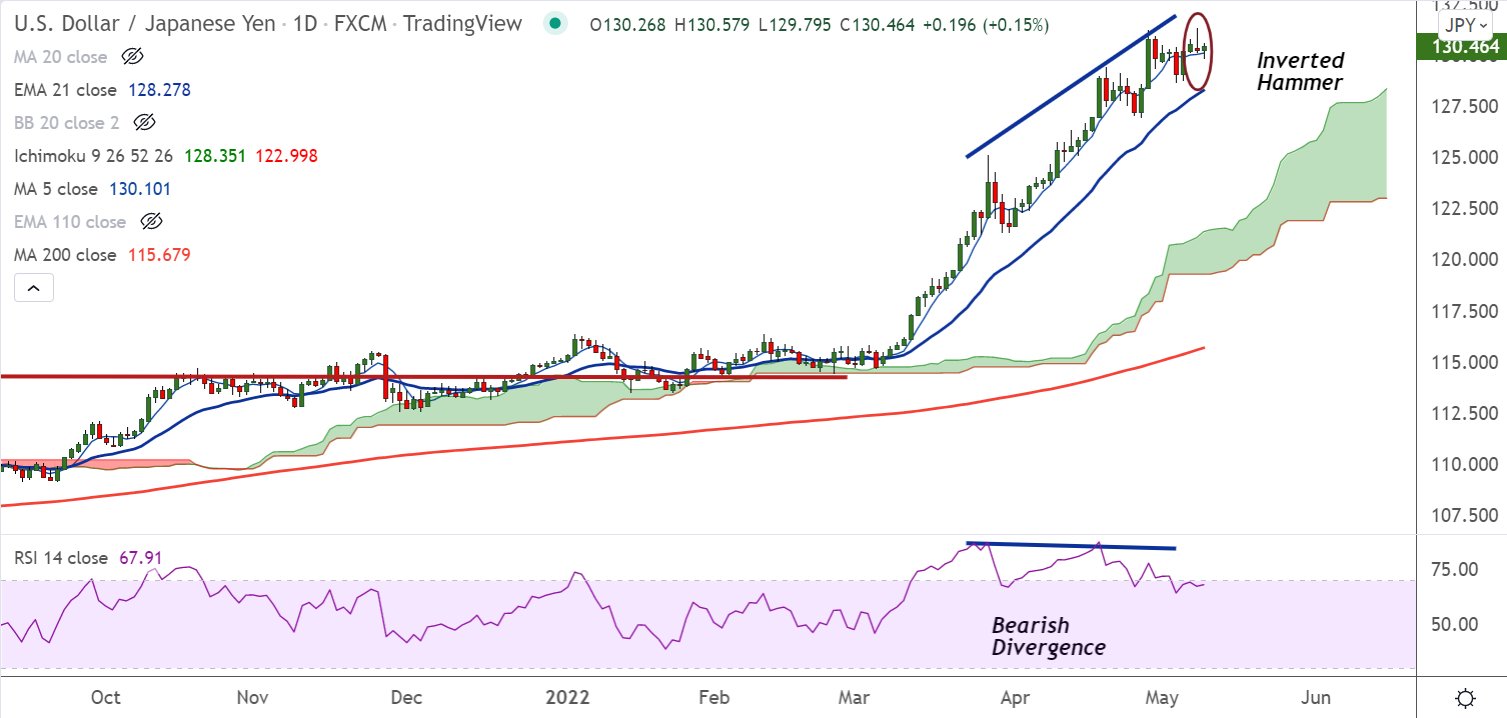
Chart - Courtesy Trading View
Technical Analysis:
- USD/JPY was trading 0.13% higher on the day at 130.43 at around 05:00 GMT
- The pair is trading pivotal at 200H MA support, decisive break below will drag the pair lower
- Inverted Hammer formation on Monday's candle dents upside in the pair
- MACD shows bearish crossover on signal line. Bearish RSI divergence adds to the downside bias
Fundamental Overview:
Pullback in US Treasury yields and mildly positive market sentiment after mixed Fedspeak, softer inflation expectations keep US dollar under pressure.
Fears of inflation weighing on the economic outlook, as well as China’s covid woes, stay on the table to cushion downside in USD/JPY.
Wednesday’s US CPI ex Food & Energy for April, expected 6.0% YoY versus 6.5% prior, will be crucial as the Fed’s 75 bps rate hike looms.
Major Support Levels:
S1: 130.19 (200H MA)
S2: 128.67 (20-DMA)
Major Resistance Levels:
R1: 131.34 (May 9th high)
R2: 131.85 (Upper BB)
Summary: USD/JPY could see some weakness in the near-term. Major trend however remains bullish. 20-DMA at 128.67 is strong support.


