


USD/JPY chart - Trading View
- USD/JPY hits 6-week lows at 109.70, extends weakness below 110 handle.
- The major trades under pressure at the beginning of the week, bias bearish.
- US Treasury yield curve inverted for the first time since 2007, triggering alerts about a possible recession.
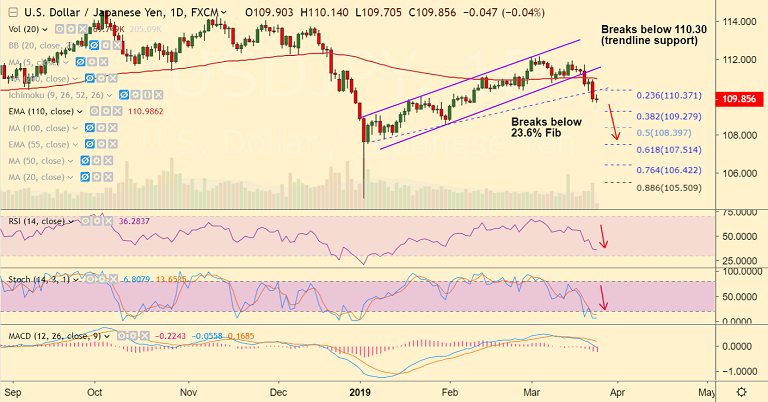
- Technical indicators on the daily charts have turned bearish. The pair has broken below rising channel raising scope for weakness.
- Price action has dipped below 23.6% Fib retracement of 104.656 to 112.137 rise (110.37) and strong trendline support (110.30).
- Japan will release the January All Industry Activity Index shortly, expected at 0.2% vs. the previous -0.4%.
- Bias bearish, we see scope for test of 38.2% Fib at 109.27 ahead of 108.50 (Jan 31 low)
Support levels - 109.27 (38.2% Fib), 109, 108.50 (Jan 31 low)
Resistance levels - 110.37 (23.6% Fib), 110.85 (55-EMA), 111
Recommendation: Good to go short on upticks, SL: 110.40, TP: 109.30/ 109/ 108.50
For details on FxWirePro's Currency Strength Index, visit http://www.fxwirepro.com/currencyindex.


