


 Elon Musk’s Empire: SpaceX, Tesla, and xAI Merger Talks Spark Investor Debate
  JPMorgan Lifts Gold Price Forecast to $6,300 by End-2026 on Strong Central Bank and Investor Demand


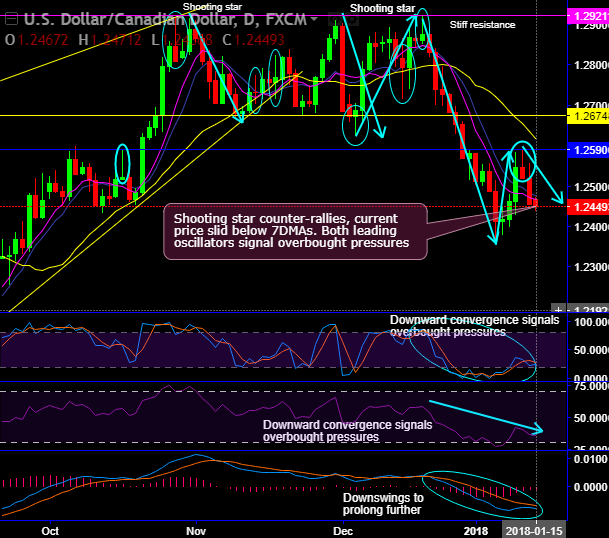
Shooting star pattern candle has occurred at 1.2519 levels.
As and when this bearish pattern occurs, please observe the steep price dips.
Please go through below weblink before we move on to our updated analysis on this pair:
We had anticipated price dips more than a fortnight ago at around 1.2620 levels, you are now witnessing considerable bearish pressures.
USDCAD bulls have had noticeable bounces in the recent times bottoming out at 1.2355 levels upto the peaks of 1.2590 levels, that’s where bears have resumed.
As a result, shooting star and spinning top patterns have occurred on intraday plotting at 1.2565 and 1.2560 levels respectively (refer intraday plotting).
Consequently, these bearish patterns have countered previous rallies, the current prices still remain well below 7DMAs despite the attempts of bull rallies. While both leading oscillators signal overbought pressures at this juncture.
Please be extra keen on last six months’ price behavior, although the intermediary bulls have managed to test the strong support at 50% Fibonacci levels, the rallies have been restrained below 21EMA levels couple of times in this span.
Strong supports were seen at 1.2064 levels, observe sharp rallies as the pair touches these levels, this event has happened twice in last two and half years. But since last November, the prices have collapsed as it approached 50% Fibonacci levels. The same incidence has happened even in in this month’s price action.
Hammer occurs to bring in upswings but 3-black crow pattern coupled with EMA crossover & OB pressures signals weakness, current prices slid & restrained below 7EMAs
Thereby, you could observe the stiff resistance at 1.2921 levels, that’s where more bearish pattern candles have occurred, consequently, considerable price dips have slid below EMAs.
Well, let’s not isolate this analysis, to substantiate this bearish stance, both leading oscillators (RSI and stochastic indicators) converge downwards constantly to the ongoing price dips that signal the intensified momentum and strength the prevailing bearish sentiments. Same has been the case in monthly terms.
Contemplating bearish trend, at spot reference: 1.2444, it is wise to snap deceptive rallies to deploy tunnel spreads with upper strikes at 1.2475 and lower strikes at 1.2419.
The trading between these strikes likely to derive certain yields, more importantly, these yields are exponential from spot movements.
Currency Strength Index: FxWirePro's hourly CAD spot index is inching towards -61 levels (which is bearish), while hourly USD spot index was at -147 (highly bearish) while articulating (at 05:44 GMT). For more details on the index, please refer below weblink:
http://www.fxwirepro.com/currencyindex.
FxWirePro launches Absolute Return Managed Program. For more details, visit:


