


 U.S. Stock Futures Slide as Tech Rout Deepens on Amazon Capex Shock
  Singapore Budget 2026 Set for Fiscal Prudence as Growth Remains Resilient
  Global Markets Slide as AI, Crypto, and Precious Metals Face Heightened Volatility
  Japanese Pharmaceutical Stocks Slide as TrumpRx.gov Launch Sparks Market Concerns
  UK Starting Salaries See Strongest Growth in 18 Months as Hiring Sentiment Improves
  Gold Prices Fall Amid Rate Jitters; Copper Steady as China Stimulus Eyed
  India–U.S. Interim Trade Pact Cuts Auto Tariffs but Leaves Tesla Out
  Russian Stocks End Mixed as MOEX Index Closes Flat Amid Commodity Strength
  Dollar Near Two-Week High as Stock Rout, AI Concerns and Global Events Drive Market Volatility


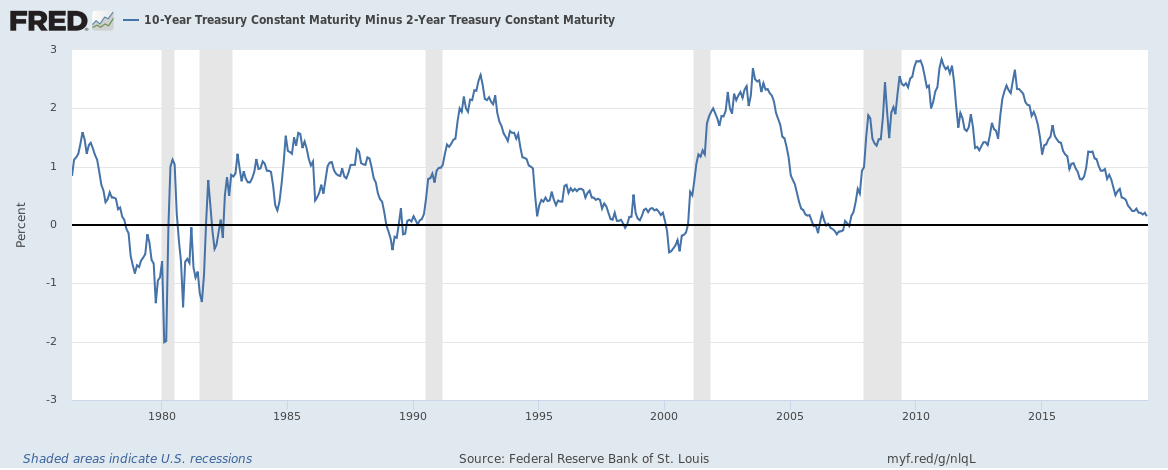
There are many indicators like PMI reports, jobs reports, inflation, industrial output, business sales etc. that we take a look into in determining whether the US economy is slowing down and heading for a recession but there is one indicator we are not losing sight of which is widely considered as the most reliable predictor of a recession and that is the yield difference between a 10-year U.S. Treasury bonds and a 2-year treasury bonds.
This chart from the St. Louis Fed’s economic dashboard shows that the spread has correctly predicted the last five recession. Every time before the US economy suffered a recession, the spread dipped below zero. Recession follows within 24 months, whenever spread dips below zero.
The spread has been steadily declining since 2014, as the U.S. Federal Reserve raised interest rates from 0.25 percent to 2.25 percent, pushing short-term rates higher, while lower inflation expectation pushed long-term yields lower.
Despite the downturn, a journey towards zero is still likely to be a long process and the possibility of an immediate recession in the United States remains a far-fetched idea. The spread is currently at 15 bps.
U.S. GDP growth also suggests that the recession is still a far-fetched idea. Despite the recent slowdown, the U.S. economy grew by 2.6 percent y/y in the fourth quarter.


