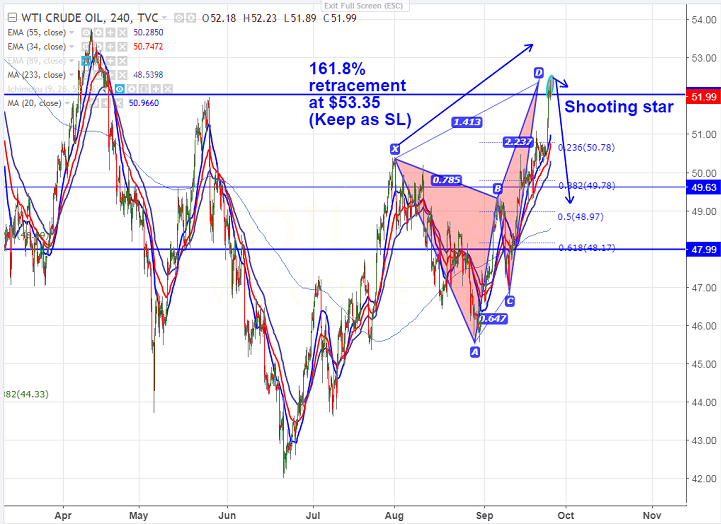
- Harmonic pattern formed – Bearish Butterfly pattern
- Potential reversal Zone (PRZ) - $53.35 (161.8% retracement of $50.40 and $45.84).
- WTI crude oil has shown a good jump after breaking high of $51.09 made on Sep 20th 2017 and jumped till $52.40. It is currently trading around $51.97.
- The commodity has formed bearish Butterfly pattern and potential reversal zone is around $53.35. Any violation above that level confirms bullish continuation. The near term resistance is around $52.40.
- On the lower side, major near term support is around $51.23 (4H Kijun-Sen) and any break below will drag the commodity down till $50.85 (20- 4H MA)/$50/$48.97 (50% retracement of $45.57 and $52.41).
It is good to sell on rallies around $52.25-30 with SL around $53.35 for the TP of $50.90/$50.


FxWirePro: USD/ZAR edges higher but bearish outlook persists
FxWirePro: EUR/NZD positions for another drop, eyes 2.0100 level
FxWirePro: GBP/USD runs out of steam but maintains bullish outlook
FxWirePro- Major Pair levels and bias summary
FxWirePro: EUR/CAD extends fall, vulnerable to more downside
FxWirePro: USD/CNY hits 15-month low , scope for further downside
Ethereum Stuck in Neutral: Range-Bound at $2.9K with Bearish EMAs – But Dip-Buyers Eye $2958 for $3600+ Breakout
FxWirePro: USD/ZAR outlook weaker on renewed downside pressure
FxWirePro: EUR/AUD attracts selling interest, vulnerable to more downside
FxWirePro: GBP/ NZD neutral in the near-term, scope for downward resumption
FxWirePro- Woodies Pivot(Major)
NZD/JPY Drifts Sideways: Mixed Signals Say “Stand Aside for Now”
FxWirePro: USD/CAD dips below lower range, bearish bias increases
CAD/JPY Holds Positive Bias Despite Canada’s Sharp GDP Contraction: Buy Dips Toward 116 Target 


