


 FxWirePro: Daily Commodity Tracker - 21st March, 2022
  Gold Prices Fall Amid Rate Jitters; Copper Steady as China Stimulus Eyed


Natural gas is currently trading at $2.6 per MMBtu.
Key factors at play in the natural gas market –
- The price of natural gas has significantly come down since December after a massive spike in November. Likely to find support around $2.5 area.
- Gas prices are likely to remain depressed as the price is crushing in Europe. Price in the UK declined to 48 pence per therm, down from record 84 pence.
- Qatar has significantly increased investments in natural gas after it moved out of the OPEC cartel.
- The United States and the European Union have agreed in principle in bringing U.S. LNG to Europe. Poland is likely to be receiving the gas.
- China surpassed Japan as the biggest natural gas importer.
- Japan’s nuclear power generation is reviving again, which would curtail the LNG demand.
- Russia and the United States are set to fight for market share in Asia and in Europe. US preparing to become major natural gas exporter to the EU and Asia.
- Large Natural gas producers in the United States continue to expand production per rig. US exports are increasing significantly. The United States remains the largest petroleum and natural gas producers in the world.
- U.S. production is rising fast. Currently, the U.S. is the third biggest exporter of natural gas.
- U.S. exit from Iran nuclear agreement complicates the future of vast natural gas reserves in Iran. Recently, the French energy giant ‘Total’ exit lucrative Iran gas project amid sanctions. However, so far, China has filled the gaps.
- Europe and Russia considering energy payments in euro.
- Russia and Iran are likely to dominate the Chinese gas market, fastest growing in the world.
- With natural gas turning into a buyers’ market, big importers like Japan are renegotiating long term contracts with a resale clause attached.
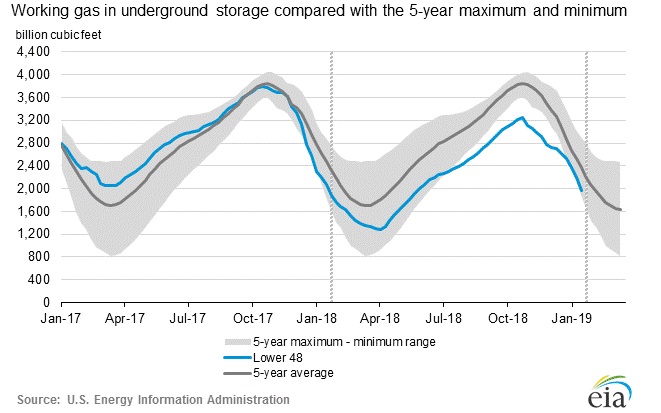
Now, for the inventory,
According to the latest numbers, working gas in the underground storage remains at 1.96 trillion cubic feet (Tcf). Stocks are 135 Bcf less than last year at this time and 415 Bcf below the five-year average. The chart from EIA shows the level of inventory. The second chart from investing.com shows weekly changes in inventory.
- Last week, the inventory declined by 237 billion cubic feet against an expectation of 245 billion cubic feet decrease. Today 79 billion cubic feet draw expected.
- EIA will release the inventory report at 15:30 GMT.


