


 FxWirePro: Daily Commodity Tracker - 21st March, 2022


Natural gas is currently trading at $4.19 per MMBtu.
Key factors at play in the natural gas market –
- The natural gas price is gradually moving lower after reaching $5 per MMBtu. The lower level of inventories is keeping the price supported.
- The United States and the European Union have agreed in principle in bringing U.S. LNG to Europe.
- China surpassed Japan as the biggest natural gas importer.
- Russia says that the biggest pipeline project reaching China is almost over.
- Japan’s nuclear power generation is reviving again, which would curtail the LNG demand.
- Price in Europe declining sharply after breaking into record highs and currently trading at 65 pence therm. Russia and the United States are set to fight for market share in Asia and in Europe. US preparing to become major natural gas exporter to the EU and Asia.
- Large Natural gas producers in the United States continue to expand production per rig. US exports are increasing significantly. The United States remains the largest petroleum and natural gas producers in the world.
- U.S. production is rising fast. Currently, U.S. is the third biggest exporter of natural gas.
- U.S. exit from Iran nuclear agreement complicates the future of vast natural gas reserves in Iran. Recently, French energy giant ‘Total’ exit lucrative Iran gas project amid sanctions.
- NATO sanctions on Russia might disrupt its gas supplies to Europe.
- Russia is likely to dominate the Chinese gas market, fastest growing in the world.
- With natural gas turning into a buyers’ market, big importers like Japan are renegotiating long-term contracts with a resale clause attached.
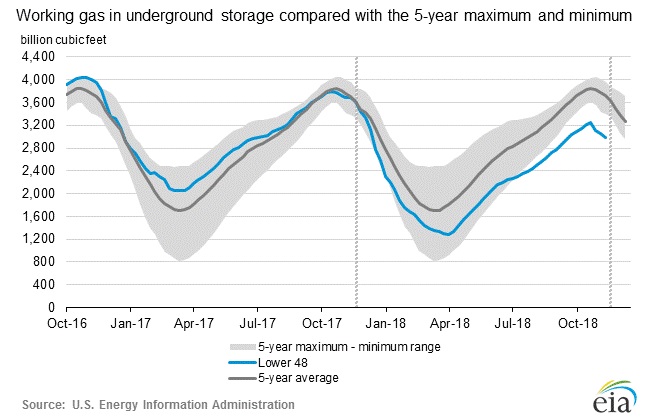
Now, for the inventory,
According to the latest numbers, working gas in underground storage remains at 2.991 trillion cubic feet (Tcf). Stocks are 704 Bcf less than last year at this time and 725 Bcf below the five-year average. The chart from EIA shows the level of inventory. The second chart from investing.com shows weekly changes in inventory.
- Last week, the inventory declined by 63 billion cubic feet against an expectation of 61 billion cubic feet decrease. Today 84 billion cubic feet draw expected.
- EIA will release the inventory report at 15:30 GMT.


