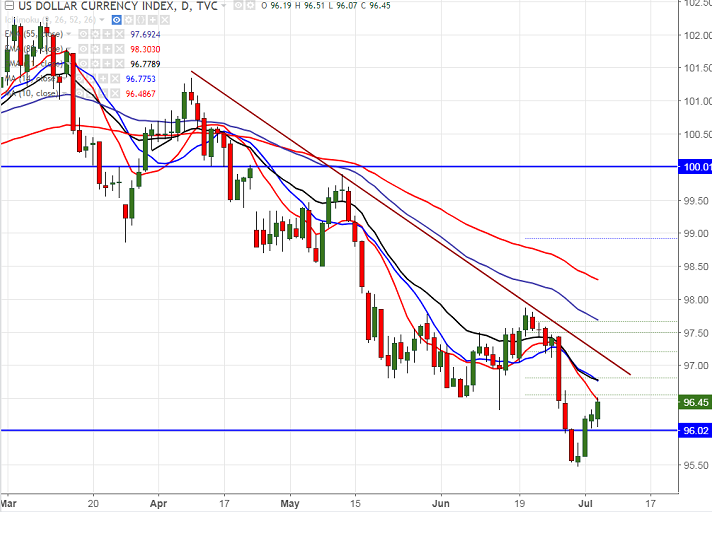
- U.S dollar index formed a bottom around 95.47 and slightly recovering from that level. It is currently trading around 96.35.
- In the daily chart, index upside capped by 10 –day MA and any break above will take the DXY till 97/97.25.
- Any close above 96.59 will take the index till 96.96 (61.8% retracement of 97.87 and 95.47)/97.25.
- On the lower side, any break below 95.47 will drag the index till 95/94.60 in the short term.
- Short term bearish invalidation only above 97.87.
It is good to buy on dips around 96-96.10 with SL around 95.47 for the TP of 96..59/96.96


FxWirePro: EUR/AUD slips following RBA minutes , plunge to test a key fibo grows
FxWirePro: EUR/CAD slips as firm oil price lift loonie despite soft GDP data
FxWirePro: EUR/NZD set for bigger drop, but close below key fibo needed
FxWirePro: GBP/USD runs out of steam but maintains bullish outlook
AUDJPY Bulls in Control: Buy the Dips Above 103.80 for a Run Towards 106
FxWirePro: USD/ZAR down trend loses steam, remains on bearish path
FxWirePro: GBP/AUD tracks lower on firmer Australian dollar
FxWirePro: USD/ZAR outlook weaker on renewed downside pressure
FxWirePro- Woodies Pivot(Major)
CAD/JPY Holds Positive Bias Despite Canada’s Sharp GDP Contraction: Buy Dips Toward 116 Target
FxWirePro: EUR/CAD extends fall, vulnerable to more downside
FxWirePro: USD/CAD dips below lower range, bearish bias increases
FxWirePro- Major Crypto levels and bias summary
FxWirePro: USD/CAD outlook weaker on renewed downside pressure
FxWirePro- Major Pair levels and bias summary
FxWirePro: AUD/USD gaining momentum for a move towards 0.6800 level 


