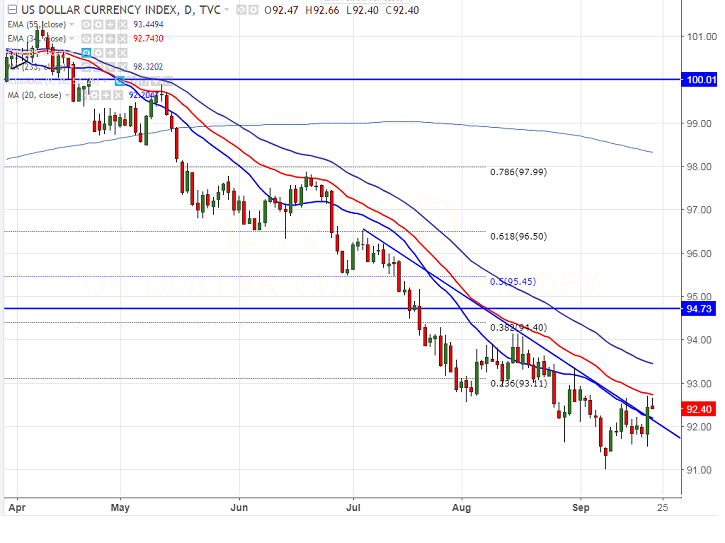
- US Dollar index is trading in narrow range between 92.66 and 91.58 for the past three trading session. It is currently trading around 92.41.
- Short term bullishness can be seen only above 92.36- 92.60 (daily Kijun-Sen, 20- day MA and trend line resistance).
- Any violation above 92.60 will take the pair to next level 93.11/93.60/94.15/95 in the short run. The minor resistance is around 91.82/92.27.
- The index major support is at 91 low made yesterday and break below targets 90.
It is good to buy on dips around 92.35 with SL around 91.90 for the TP of 93.35/94.15.


Ethereum Stuck in Neutral: Range-Bound at $2.9K with Bearish EMAs – But Dip-Buyers Eye $2958 for $3600+ Breakout
FxWirePro: GBP/USD runs out of steam but maintains bullish outlook
FxWirePro: USD/ZAR outlook weaker on renewed downside pressure
FxWirePro: USD/JPY bears maintain upper hand
FxWirePro: AUD/USD bulls gain momentum heading into the year end
FxWirePro: USD/CAD dips below lower range, bearish bias increases
FxWirePro- Major Pair levels and bias summary
Bitcoin Stalls on Boxing Day: Flat at $87K Amid Bearish EMAs – But CCI Signals Buy Dips to $85K for $100K+ Targets
FxWirePro: USD/CAD dips below lower range, bearish bias increases
FxWirePro: GBP/USD runs out of steam but maintains bullish outlook
FxWirePro: EUR/AUD dips below lower range, bearish bias increases
FxWirePro: GBP/ NZD neutral in the near-term, scope for downward resumption
FxWirePro- Major Crypto levels and bias summary
NZD/JPY Drifts Sideways: Mixed Signals Say “Stand Aside for Now”
AUD/JPY Buoyed by Holiday Calm: Buy the Dips Above 103.80 for a Run Toward 106 


