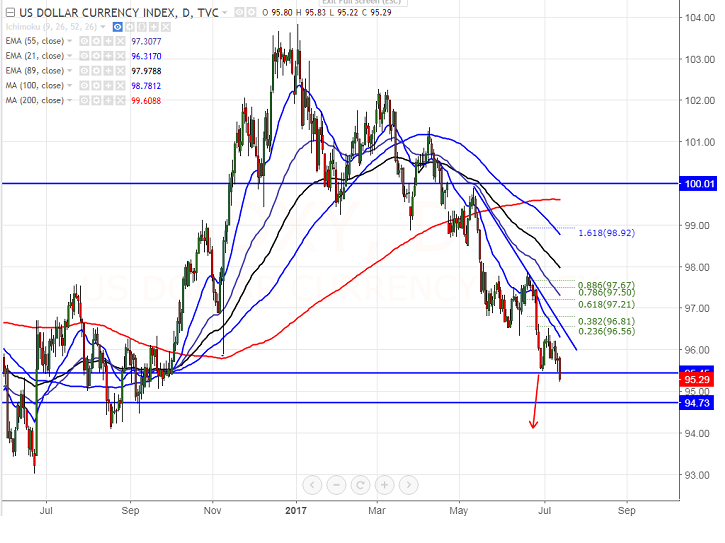
- U.S dollar index has broken major support at 95.47 low made on Jun 30th 2017. It is currently trading around 95.28.
- In the daily chart, index upside capped by daily Kijun-Sen at 96.67 and any break above will take the DXY till 97/97.25.
- On the lower side, any close below 95.47 will drag the index till 95/94.60 in the short term.
- Short term bearish invalidation only above 97.87.
It is good to sell on rallies around 95.35-95.40 with SL around 96 for the TP of 94.10.


FxWirePro: GBP/AUD downside pressure builds, key support level in focus
FxWirePro: EUR/CAD slips as firm oil price lift loonie despite soft GDP data
FxWirePro: USD/CNY hits 15-month low , scope for further downside
FxWirePro: USD/ZAR outlook weaker on renewed downside pressure
FxWirePro: USD/CAD outlook weaker on renewed downside pressure
FxWirePro: EUR/AUD slips following RBA minutes , plunge to test a key fibo grows
FxWirePro- Woodies Pivot(Major)
CAD/JPY Holds Positive Bias Despite Canada’s Sharp GDP Contraction: Buy Dips Toward 116 Target
FxWirePro: USD/ZAR down trend loses steam, remains on bearish path
NZDJPY: Sell the Rallies as Bears Guard 92 and Range Trade Persists
EUR/GBP Holiday Slumber: Bearish Bias Intact Below 0.8800 Resistance
FxWirePro: EUR/NZD downside pressure builds, key support level in focus
USD/CHF Bears in Control: Dips Below 0.7870 Signal More Downside Ahead
FxWirePro: EUR/AUD attracts selling interest, vulnerable to more downside 


