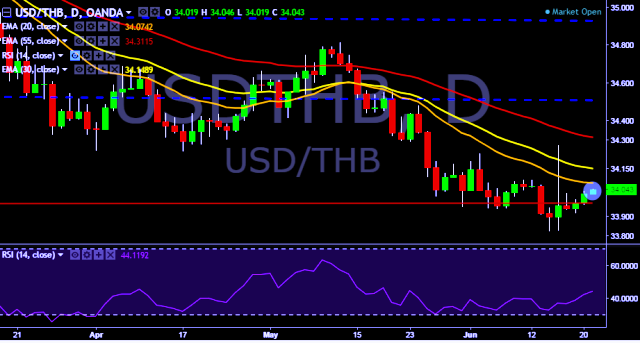
- USD/THB is currently trading around 34.04 marks.
- It made intraday high at 34.04 and low at 34.02 marks.
- Intraday bias remains bullish for the moment.
- On the top side, key resistances are seen at 34.02, 34.27, 34.34, 34.48, 34.55, 34.67, 34.74, 34.82, 34.97, 35.11 and 35.20 marks respectively.
- Alternatively, a daily close below 34.00 will drag the parity down towards key supports around 33.92, 33.82, 33.74, 33.58, 33.01 and 32.54 marks respectively.
- Important to note here that 20D, 30D and 55D EMA heads down and confirms the bearish trend in a daily chart. Current upside movement is short term trend correction only.
We prefer to take long position in USD/THB around 34.02, stop loss 33.92 and target of 34.27.


FxWirePro: GBP/AUD tracks lower on firmer Australian dollar
AUDJPY Bulls in Control: Buy the Dips Above 103.80 for a Run Towards 106
CAD/JPY Holds Positive Bias Despite Canada’s Sharp GDP Contraction: Buy Dips Toward 116 Target
FxWirePro- Major Pair levels and bias summary
FxWirePro: GBP/AUD downside pressure builds, key support level in focus
FxWirePro: USD/CAD dips below lower range, bearish bias increases
FxWirePro: EUR/CAD slips as firm oil price lift loonie despite soft GDP data
FxWirePro: USD/ZAR down trend loses steam, remains on bearish path
NZDJPY: Sell the Rallies as Bears Guard 92 and Range Trade Persists
FxWirePro: GBP/USD runs out of steam but maintains bullish outlook
FxWirePro- Major Crypto levels and bias summary
FxWirePro- Major Pair levels and bias summary
FxWirePro: USD/CAD outlook weaker on renewed downside pressure
GBP/JPY Stuck in Holiday Neutral: Range-Bound at 210 Ahead of Christmas 


