


- USD/SGD is currently trading around 1.4192 marks.
- It made intraday high at 1.4197 and low at 1.4173 levels.
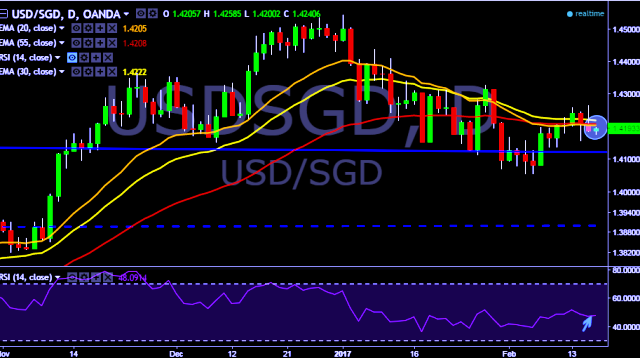
- Intraday bias remains neutral till the time pair holds key resistance at 1.4250 marks.
- A daily close above 1.4187 will test key resistances at 1.4250, 1.4409, 1.4506, 1.4568, 1.4686 and 1.4851 levels respectively.
- Alternatively, a consistent close below 1.4187 will drag the parity down towards key supports at 1.4136/1.4083/1.3972/1.3819/1.3775/1.3704/1.3646 levels respectively.
- Important to note here that 20D, 30D and 55D EMA heads up and confirms the bullish trend in a daily chart. Current downside movement is short term trend correction only.
Positioning is inconclusive at this point, with prices offering no clear cut signal to initiate a long or short trade. We will continue to remain on sidelines for the time being.


