


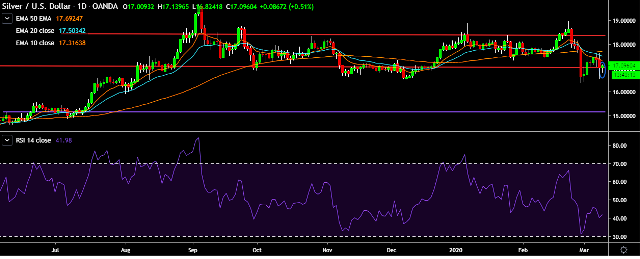
- XAG/USD is currently trading around $17.09 marks.
- It made intraday high at $17.13 and low at $16.82 levels.
- Intraday bias remains neutral for the moment.
- A daily close above $17.02 will test key resistances at $17.12, $17.27, $17.40, $17.67, $17.92 and $18.22 marks respectively.
- On the other side, a daily close below $17.00 will take the parity down towards key supports at $16.87, $16.62, $16.40, $16.22, $16.02 and $15.87 marks respectively.
- Important to note here that 20D, 30D and 55D EMA heads down and confirms the bearish trend in a daily chart.
We prefer to take long position on XAG/USD only above $17.13, stop loss at $16.80 and target of $17.27/$17.40.


