


 FxWirePro- Major Crypto levels and bias summary
  Nasdaq Proposes Fast-Track Rule to Accelerate Index Inclusion for Major New Listings


Technical watch:
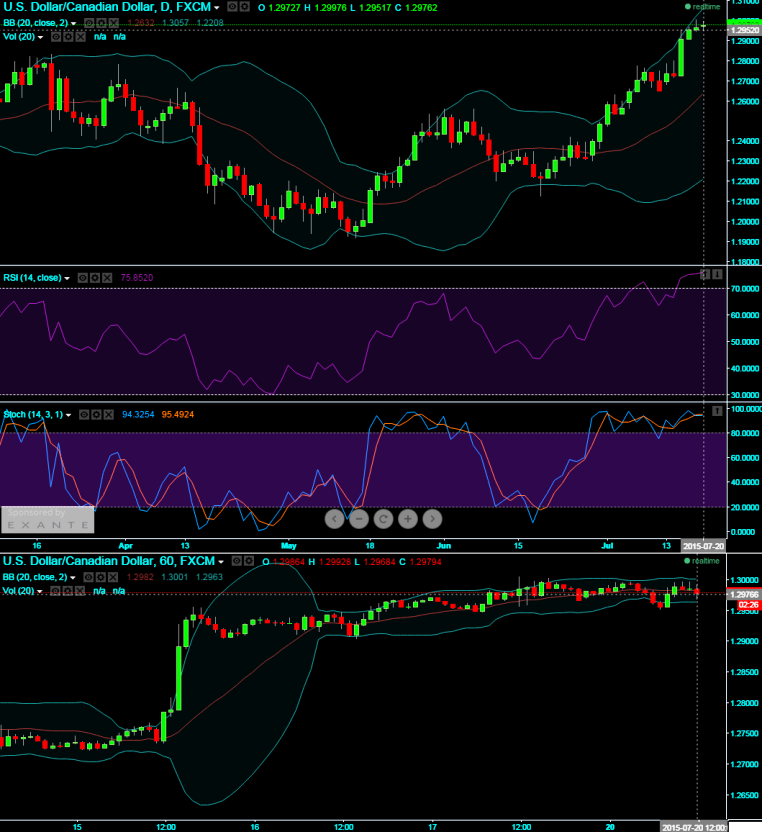
Is USD taking a halt from its ruthless bull run against CAD which has started almost a month ago (on 18th June)? The pair has spiked up from the lows 1.2126 levels with minor hick-ups to reach 6 year's highs.
Daily charts send an early alert to bulls a matter of caution and alarms for bears to capture early downswings. We traced out at peaks of uptrend a Shooting star pattern candle occurred at 1.2967 levels.
RSI (14) evidences a divergence with the price spikes at 73.6815 levels which is considered as overbought zone. This has been substantiated by Doji patterns occurred on intraday charting. So, we believe finally there was a sort of bearish sensation is seen on this pair. However, in a long-run uptrend still remains intact as weekly chart looks quite healthy for bulls.
Put Ratio Back Spread: USD/CAD
With this technical reasoning, we recommend arresting initial downside risks of this pair by hedging through Put Ratio back Spread since we expect the underlying currency (USDCAD) to make some downside moves.
Purchase 1M 2 lots of At-The-Money -0.49 delta puts and sell 1M one lot of (1%) In-The-Money put option usually in the ratio of 2:1 or 3:2.
The short ITM puts funds to the purchase of the greater number of long puts and the position is entered for no cost or a net credit. The delta of combined positions should be around -0.32 with slightly negative theta value. If a disciplined hedger strictly follows all these mathematical computations, then irrespective of market sentiments, one can be rest assured with the risk-free exposures in his foreign trade.
The underlying exchange rate has to make substantial move on the downside for the gains in long puts to overcome the losses in the short puts as the maximum loss is at the long strike. We prefer lengthier time for maturity so as to make a substantial move on the downside.

- News

- Economy

- Central Banks
- Investing
- Research
- Roundups
- Digital Currency
- Insights
- Technical Analysis
- Technology
- Business
- Law
- Health
- Nature
- Fintech
- Science
- Topic
- Opinions
- ©Econometrics LLC . All Rights Reserved.
FxWirePro: Shooting Star signifies bearish divergence on USD/CAD; PRBS keeps tight hedging
Monday, July 20, 2015 1:26 PM UTC
Editor's Picks


- Market Data
Most Popular


