


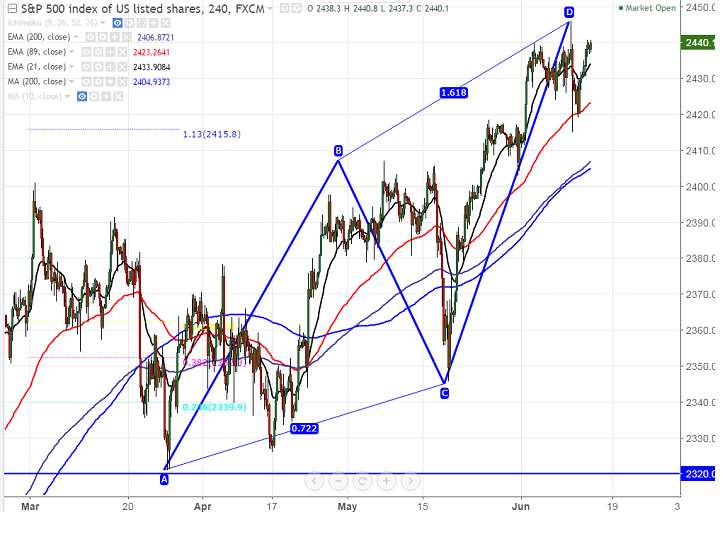
- Harmonic pattern – Bearish AB=CD pattern.
- Potential Reversal Zone (PRZ) – 2445.
- S&P500 is consolidating in narrow range between 2445 and 2404 for the past ten trading session. It is currently trading around 2440.
- In the daily chart the index has formed potential Bearish AB=CD pattern and got completed at 2445.Any break above potential reversal zone will take the S&P500 till 2457 (161.8% retracement of 2401 and 2321).
- On the lower side, major support is around 2396 (daily Kijun-Sen) and any break below will drag the index till 2367 (89 EMA)/2345 (May 18th 2017 low).
It is good to sell on rallies around 2440-2445 with SL around 2457 for the TP of 2390/2359.


