


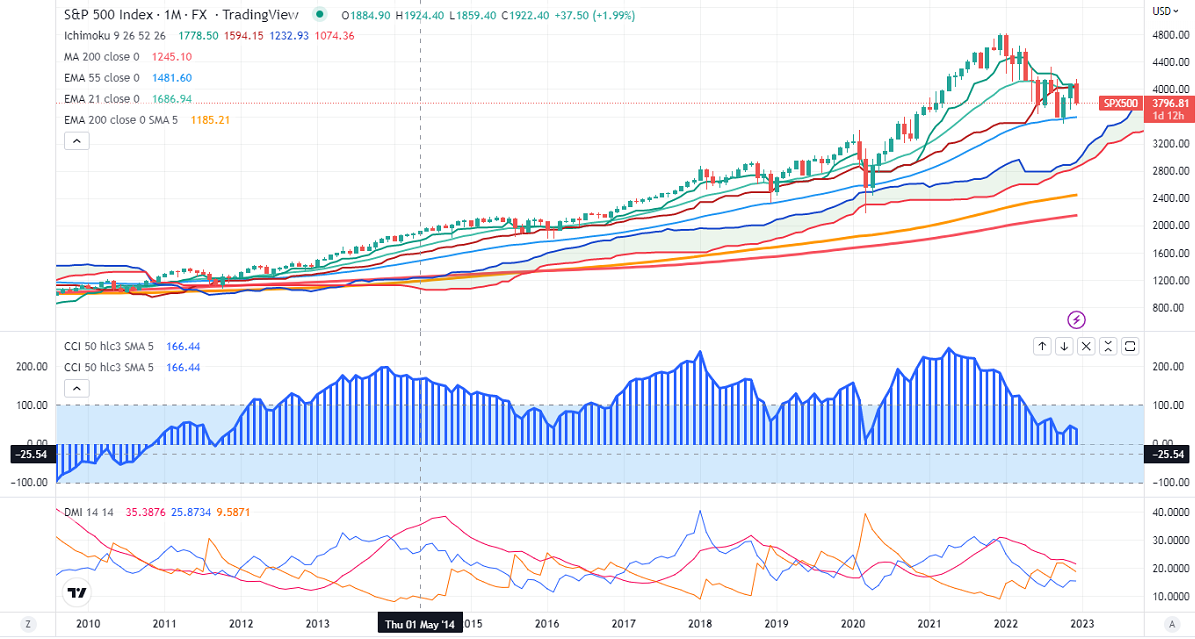
S&P500 has taken support near 55-Monthly EMA
.
Bearish continuation only if it closes below 3491 (Low made on Oct 13th, 2022)
Ichimoku Analysis (Monthly chart)
Tenken-Sen-4065
Kijun-Sen- 4027
S&P500 was one of the worst performers and lost more than 1000 points this year. Fed hiked rates by 425 basis points in 2022 due to high inflation. US inflation reached its peak in June 2022 at 9.1% and fell to 7.1% in Nov. The geopolitical tension between Russia and Ukraine and renewed Coronavirus cases in China also dragged US markets down.
From here, any violation below 3696 (200- W EMA) will drag down till 3495. A major sell-off will happen if it breaks 3490. A dip to 3000 is possible.
A minor pullback till 4145 can be seen if it surges past the 3900 level. Any breach above 4200 will take the index to 4325/4800.
Indicator (Monthly chart)
CCI – Bullish
Directional movement index- Neutral
It is good to sell on rallies around 4350-60 with SL around 4800 for the TP of 3000.


