


 Best Gold Stocks to Buy Now: AABB, GOLD, GDX


The U.S. benchmark stock index S&P 500 has returned 19.3 percent in 2017 and that is after the index had seven consecutive years of a bull run. In addition to that, the index has returned around 4.6 percent in the first 15 days of 2018. Despite all the optimism surrounding the Trump Presidency, administration’s reduction in red tape regulations and tax reforms, we believe that the index has become too hot. Many of the traditional indicators are strongly suggesting so. We would discuss some of them here,
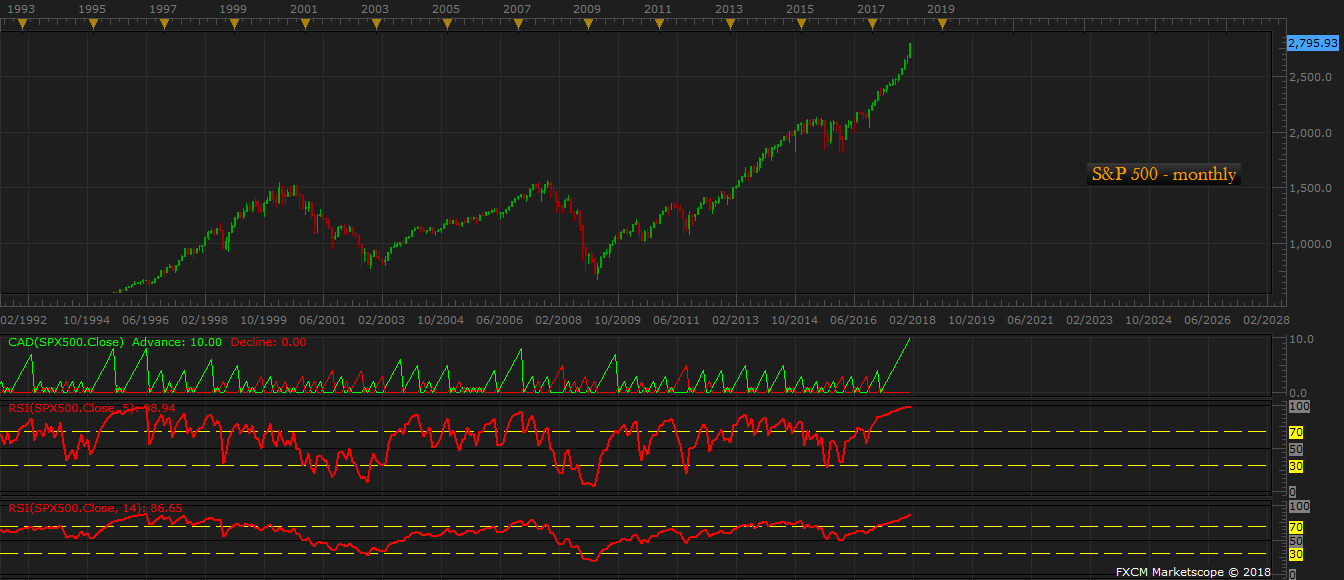
- Chart 1 is a monthly chart of S&P500 index. The indicator just below the chart shows that S&P is not only in its 9th consecutive year of the bull run, it is enjoying a 10th consecutive monthly bull run, which is the longest in at least three decades.
- The next indicator, Relative Strength Index (RSI), which is an oscillator that oscillates between zero and 100 and shows overbought and oversold level indication extreme overbought since the 5-month RSI is hovering at 98.94
- The next indicator is another RSI but a bit longer-term. But 14-month RSI is also signaling extremely overbought position as the RSI is hovering at 86.65.
It’s been more than 2-years since S&P500 had any meaningful correction. We suspect that a correction which has been long due is likely to take place soon.
The second chart is a weekly chart of S&P500.
- In weekly chart too, both the 5-week RSI and 14- week RSI strongly pointing to overbought positions as they hover at 94.4 and 88.2 respectively.
The third chart is a daily chart of S&P 500.
- The indicator below shows that currently, S&P500 is enjoying 11 consecutive days of bull run, the longest in almost 5-years.


