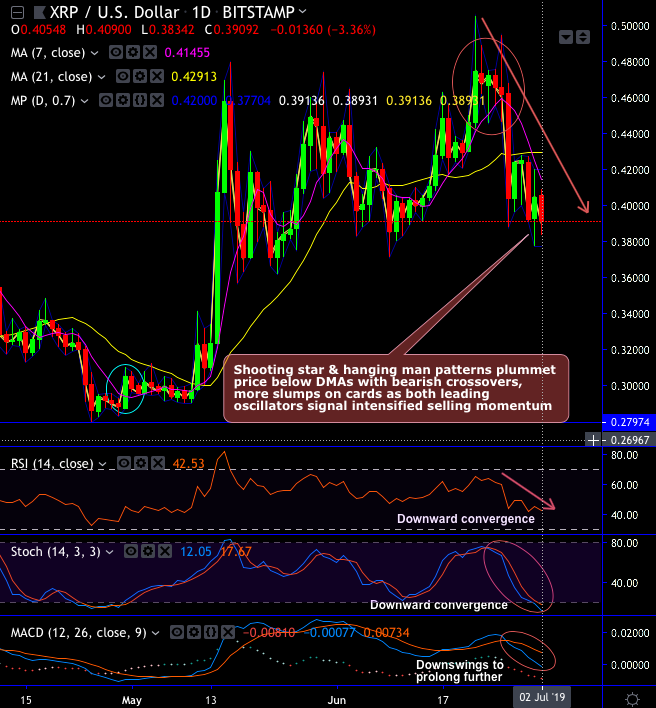
On the daily technical chart, XRPUSD’s back-to-back shooting star and hanging man pattern candles have been traced out at 0.46823, 0.47215 and 0.46522 levels to plummet prices below DMAs.
On the downside, if the bearish trend prolongs, these bearish candlesticks will drag the price dips up to strong support of the trend line at 0.38114 levels.
Yesterday, the pair attempted to make an upward move but was restrained at 7-DMAs. The XRP price is below the EMAs with bearish crossover indicates that price likely to slide further. To substantiate, the MACD shows bearish crossover which indicates downtrend to prolong further in the minor trend.
On the flip side, bullish engulfing patterns pop-up at strong support at 0.27874 levels to take-off rallies above 21-EMAs but restrained below 100-EMAs as both momentum oscillators (RSI & Stochastic curves) signal faded strength in the previous rallies.
For now, the current price wedged between 21&100-EMAs.
On the downside, if bearish momentum persists and slides below 21-EMAs, then the downtrend may resume into a previous range bound zone of the $0.30 and $0.34 price levels. If it holds that level, bullish prospects can’t be ruled out in the long run.
Fundamentally, with Ripple (XRP) has surpassed Bitcoin Cash and Litecoin in the market cap race to feature 3rdplace in the crypto-space (Mkt.cap of Ripple – $17.48 bln, Bitcoin cash - $7.5 bln), as the buying sentiments are mounting higher on banking popular crypto-coin sentiments but the understanding of the variances between the Ripple as an organization and the XRP as a token still appears to be deficient. So, it is wise to empathize the driving forces of XRP, their strategic alliances and the fundamentals of the same.
Trade tips: Contemplating above fundamental and technical rationale, one can think of shorting this pair for a target up to 0.37937 with a strict stop loss of 0.40548 levels.
But on investing grounds, XRP can be bought at the current levels for the medium-term targets up to 0.96936.
Currency strength index: FxWirePro's hourly BTC is flashing at -111 (highly bearish), hourly USD spot index was at 84 (highly bullish) while articulating (at 10:07 GMT).
For more details on the index, please refer below weblink: http://www.fxwirepro.com/currencyindex


 US Gas Market Poised for Supercycle: Bernstein Analysts
  Geopolitical Shocks That Could Reshape Financial Markets in 2025
  U.S. Stocks vs. Bonds: Are Diverging Valuations Signaling a Shift?
  Indonesia Surprises Markets with Interest Rate Cut Amid Currency Pressure
  Gold Prices Slide as Rate Cut Prospects Diminish; Copper Gains on China Stimulus Hopes
  China’s Growth Faces Structural Challenges Amid Doubts Over Data


