


 Goldman Predicts 50% Odds of 10% U.S. Tariff on Copper by Q1 Close
  U.S. Stocks vs. Bonds: Are Diverging Valuations Signaling a Shift?
  S&P 500 Relies on Tech for Growth in Q4 2024, Says Barclays
  BTC Flat at $89,300 Despite $1.02B ETF Exodus — Buy the Dip Toward $107K?
  Energy Sector Outlook 2025: AI's Role and Market Dynamics
  Bank of America Posts Strong Q4 2024 Results, Shares Rise
  UBS Predicts Potential Fed Rate Cut Amid Strong US Economic Data


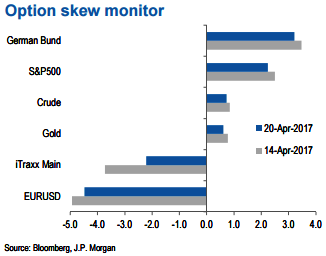
The skewness is the difference between the implied volatility of out-of-the-money (OTM) call options and put options. A positive skew implies more demand for calls than puts and a negative skew, higher demand for puts than calls. It can, therefore, be seen as an indicator of risk perception in that a highly negative skew in equities is indicative of a bearish view.
The above chart demonstrates z-score of the skew, i.e. the skew minus a rolling 2-year Avg skew divided by a rolling two-year standard deviation of the skew.
A negative skew on iTraxx Main means investors favor buying protection, i.e. a short risk position. A positive skew for the Bund reflects a long duration view, also a short risk position.
Net spec positions are the number of long contracts minus the number of short using CFTC futures only data. This net position is then converted to a USD amount by multiplying by the contract size and then the corresponding futures price.
To proxy for speculative investors, for commodity positions, we use the managed money category, for equity positions we use Leveraged funds and Asset managers (see above chart), whereas other assets use the legacy non-commercial category.
We then scale the net positions by open interest. The chart shows the z-score of these net positions, i.e. the current net position divided by the open interest, minus the average over the whole sample divided by the standard deviation of the weekly positions over the whole sample.
US rates is a duration-weighted composite of the individual UST series excluding the Eurodollar contract. UK ICE Brent positions are with one week lag. The sample starts on the 13th of June 2006.
Risky versus safe haven currencies: Difference between net spec positions on risky & safe currencies Net spec position is calculated in USD across 5 "risky" and 3 "safe" currencies (safe currencies also include Gold).
These positions are then scaled by open interest and we take an average of "risky" and "safe" assets to create two series. The chart is then simply the difference between the "risky" and "safe" series.
The final series shown in the chart below is demeaned using data since 2006. The risky currencies are AUD, NZD, CAD, RUB, MXN, and BRL. The safe currencies are JPY, CHF, and Gold.


