


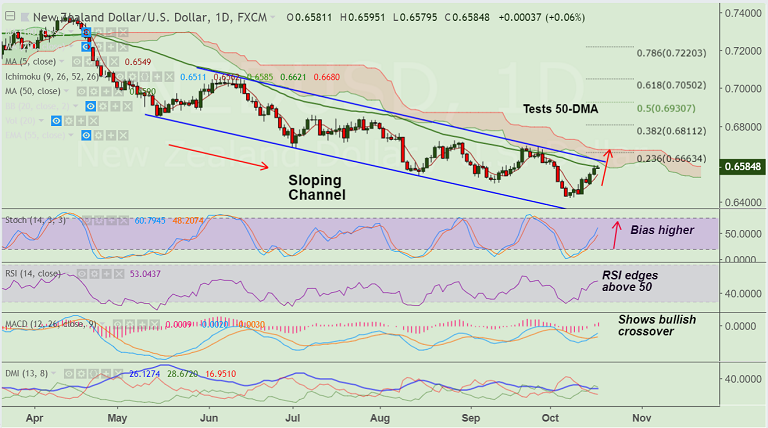
NZD/USD chart on Trading View used for analysis
- NZD/USD grinds higher, tests 50-DMA at 0.6590, bias higher.
- Kiwi supported higher as New Zealand CPI beats estimates. NZ Q3 CPI came in at 0.9% q/q, higher than forecasts at 0.7%. The annualized CPI was at 1.9% (forecast 1.7%, last 1.5%).
- The pair is trading in a downward sloping channel and major trend remains bearish.
- That said, we see minor upside till 55-EMA at 0.6619. Violation there could see further upside.
- Technical indicators on daily charts are biased higher. But FOMC minutes remain a major risk.
- FOMC minutes will likely provide important context for some of the decisions at the September meeting.
- Analysts at nomura expect the minutes for the September meeting to emphasize the Committee’s expectation of another rate hike in December 2018.
- On the flipside, we see immediate support at 21-EMA at 0.6552. Break below to see resumption of weakness.
Support levels - 0.6552 (nearly converged 5-DMA and 21-EMA), 0.6525 (Sept 11 low), 0.6425 (Oct 8 low)
Resistance levels - 0.6618 (55-EMA), 0.6625 (channel top), 0.67, 0.6729 (110-EMA)
For details on FxWirePro's Currency Strength Index, visit http://www.fxwirepro.com/currencyindex.


