


NZD/USD chart - Trading View
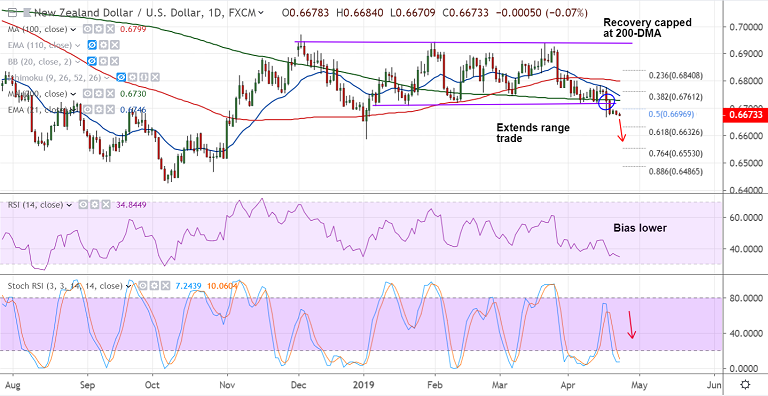
- NZD/USD is extending range trade, marginally down 0.07% at 0.6673 at 0430 GMT.
- Technical indicators support weakness, RSI and Stochs are sharply lower, MACD and DMI support downside.
- However, oversold pressure in Oscillators is hampering downside. Volatility is shrinking.
- Trend is strongly bearish. The pair has broken below 200-DMA and channel base support. Price action below cloud and major moving averages.
- GMMA indicator has indicated a shift in near-term trend. Scope for weakness till 61.8% Fib at 0.6632 and then 0.6585 (Dec 31st low).
- Oversold conditions could see minor pullbacks which could offer fresh entry levels.
- Immediate resistance is seen at 5-DMA at 0.6690. Retrace above could see upside till 0.6730 (200-DMA).
- Break below 0.6665 opens up downside. We see little support till 0.6632 (61.8% Fib).
Support levels - 0.6632 (61.8% Fib), 0.66, 0.6585 (Dec 31st low)
Resistance levels - 0.6696 (50% Fib), 0.6730 (200-DMA), 0.6745 (21-EMA)
Call update: Our previous call (https://www.econotimes.com/FxWirePro-NZD-USD-holds-support-at-channel-base-good-to-go-short-on-break-below-1526960) has hit TP1.
Recommendation: Trail SL to 0.67. Hold for further downside.
For details on FxWirePro's Currency Strength Index, visit http://www.fxwirepro.com/currencyindex.


