


NZD/USD chart - Trading View
Spot Analysis:
NZD/USD was trading 0.18% lower on the day at 0.6932 at around 04:20 GMT
Previous Week's High/ Low: 0.7086/ 0.6947
Previous Session's High/ Low: 0.7019/ 0.6934
Fundamental Overview:
Antipodeans remained depressed as investors feared that rising Delta variant COVID-19 infections could derail the global economic recovery.
On the data front overnight, US Initial Jobless Claims rose unexpectedly to 373 K, above the market expectations at 350K.
Deteriorating risk sentiment and upbeat data keep the U.S. dollar modestly bid across the board.
S&P 500 Futures were trading at 4,294 with 0.043% gains, while the dollar index (DXY) was up 0.10% at 92.44 at the time of writing.
Focus on the Reserve Bank of New Zealand (RBNZ) which is set to announce its bond purchasing program.
Technical Analysis:
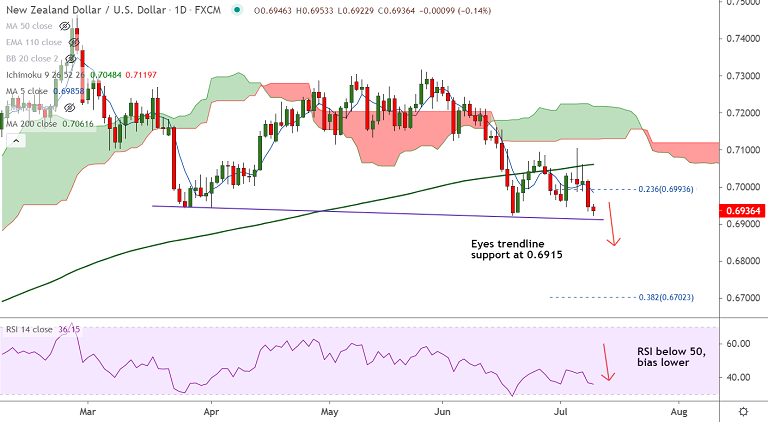
- Price action is below daily cloud and 200-DMA, slipped into weekly cloud and below 55-week EMA
- Momentum is bearish, Stochs and RSI are biased lower, RSI is below the 50 mark
- Analysis of GMMA indicator shows major and minor trend are bearish
- MACD is well below zero and -ve DMI dominance supports downside
Major Support and Resistance Levels:
Support - 0.6915 (trendline support), 0.6827 (110-week EMA), 0.68 (Psychological mark)
Resistance - 0.6985 (5-DMA), 0.70 (200H MA), 0.7061 (200-DMA)
Summary: Modest US dollar strength and a sharp deterioration in the global risk sentiment continue to dent risky assets like the kiwi. NZD/USD bears eye major trendline support at 0.6915. Break below will drive more weakness.


