


NZD/USD chart - Trading View
NZD/USD was trading largely rangebound on the day at 0.6184 at around 10:08 GMT.
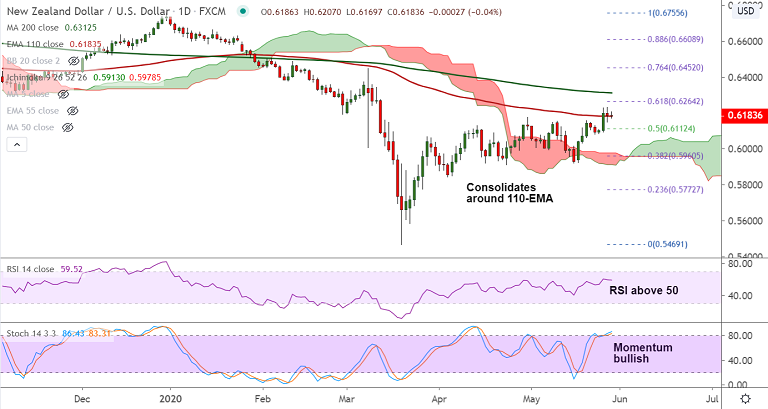
110-EMA is offering stiff resistance at 0.6183 and back-to-back Doji formations on the daily candles dampen upside scope.
Concerned about a further escalation in diplomatic tensions between the United States and China is likely to keep check on gains.
Technical indicators are biased higher. Resumption of upside will see test of 200-DMA at 0.6312.
On the data front, second estimate of U.S. Q1 GDP, Durable Goods Orders for April, Initial Weekly Jobless Claims and Pending Home Sales will be in focus for impetus.
Support levels - 0.6183 (110-EMA), 0.6152 (5-DMA), 0.6097 (55-EMA)
Resistance levels - 0.6264 (61.8% Fib), 0.6312 (200-DMA), 0.6452 (76.4% Fib)


